


Management Decisions Relative to High Nitrogen Fertilizer Prices
Nitrogen fertilizer prices continue to rise. The average anhydrous ammonia price now is over $1,100 per ton, having increased over $278 per ton in the last two weeks. Overall, these large price increases indicate that 2022 nitrogen application rates should be lowered, particularly for farmers who have been applying nitrogen above university recommended levels. Current corn and soybeans prices are at levels that result in the same relative profitability for both crops in northern and central Illinois. This article examines questions about nitrogen rates, prices in the spring, form of nitrogen, and planting decisions.
Nitrogen Fertilizer Prices
The Agricultural Marketing Service (AMS) released their latest estimates of fertilizer prices in Illinois on October 21 (see here). The average price of anhydrous ammonia was $1,135 per ton, up by $278 per ton from the price reported two weeks previously. AMS began reporting fertilizer prices on a bi-weekly basis starting in September 2008 (see Figure 1). The $278 increase is the largest ever. The next largest absolute change was a $178 decline occurring in December 2008.

Reasons for the current increases in fertilizer prices include:
- Hurricane Ida’s landfall in September closed anhydrous ammonia plants in Louisiana, leading to supply disruptions.
- Natural gas prices — a major cost item of producing nitrogen fertilizers — have been increasing in recent months. Natural gas and anhydrous ammonia prices are correlated (see farmdoc Daily, October 19, 2021).
- Corn prices have been rising. Fertilizer prices are positively correlated with corn prices (see farmdoc Daily, October 19, 2021), particularly since the rise in corn use in ethanol.
- General supply disruptions and labor issues associated with the aftermath of Covid that has impacted all industries also are impacting the fertilizer industry.
Anhydrous ammonia is not the only nitrogen fertilizer price that is increasing. Prices for urea and 28% nitrogen solutions are increasing as well (see Figure 1). On October 21, urea prices averaged $810 per ton, and 28% was $475 per ton. Over time, there is a high degree of correlation between prices for these three fertilizers. Anhydrous ammonia and urea prices have a .88 correlation coefficient, anhydrous ammonia and 28% solution prices have a .96 correlation coefficient, and urea and 28% prices have a .81 correlation coefficient.
Should I Change My Nitrogen Rates on Corn?
Most decision aids will indicate lower nitrogen rates for higher fertilizer prices. The Maximum Return to Nitrogen (MRTN) tool developed and maintained by Midwest Land Grant Universities was used to generate MRTN rates for different anhydrous ammonia and corn prices (see here). MRTN rates generated on October 24 for central Illinois are shown in Table 1.
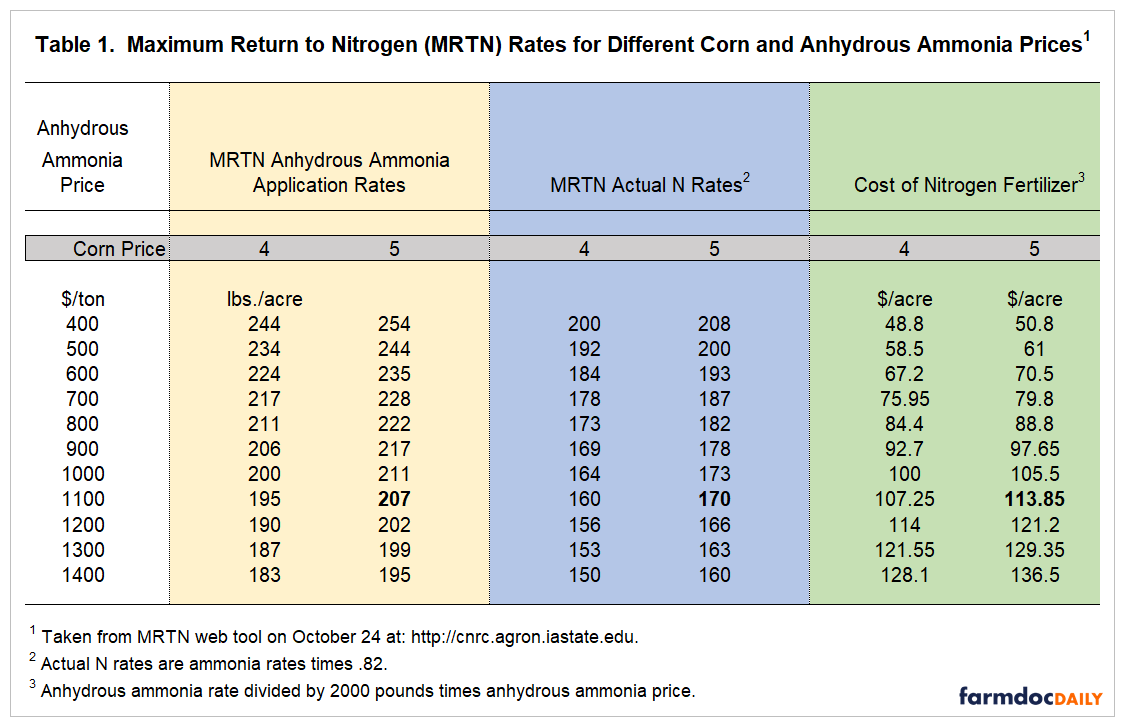
The MRTN rate of anhydrous ammonia at a $5.00 corn price and a $1,100 anhydrous ammonia price is 207 pounds per acre (see Table 1). The 207-pound rate should be used if all nitrogen is applied with anhydrous ammonia. Ammonia applications can be lowered if other fertilizers containing nitrogen are used, such as diammonium phosphate (DAP) and mono ammonium phosphate (MAP). Anhydrous ammonia is 82% nitrogen. Therefore a 207-pound application of anhydrous ammonia is 170 pounds of nitrogen (170 = .82 x 207). This rate results in nitrogen fertilizer costs of $114 per acre (see Table 1).
MRTN ammonia rates decline as fertilizer prices increase. At $500 per ton for ammonia, roughly the price last fall, the MRTN rate is 244 pounds of ammonia per acre (200 pounds of N). A $1,100 ammonia price has an MRTN rate of 207 pounds per acre of ammonia (170 pounds of N), 37 pounds lower than the 244-pound rate at $500 per ton.
Corn price influences MRTN rates. At a $1,100 anhydrous price, the MRTN is 195 pounds per acre of anhydrous ammonia for a $4.00 corn price, 12 pounds lower than the 207 MRTN rate at $5.00 per bushel.
Current economic conditions suggest MRTN rates around 207 pounds of anhydrous ammonia or about 170 pounds of actual N. These MRTN rates will be lower than last year’s MRTN rates by between 30 and 40 pounds of anhydrous ammonia. In actual N terms, MRTN rates are about 20 pounds lower.
Many farmers apply nitrogen at rates exceeding those of the MRTN. Results from Precision Conservation Management (PCM) (link) – a farm service program focused on sustainability sponsored by Illinois Corn Growers Association – indicates that 67% of farmers apply nitrogen above MRTN rates (see Sellars et al.). PCM research further indicates that there is no economic gain to applying above MRTN rates, thereby supporting results of the MRTN tool. The costs of applying above MRTN rates become greater with higher nitrogen prices. Hence, lowering 20 pounds of actual N is the lower end of rate adjustments that many farmers should be making from an economic perspective.
Will Nitrogen Prices Be Lower in Spring?
We examined the October to April price changes from 2008 through 2020. In 4 out of 14 years, or 28% of the time, anhydrous ammonia price was lower in April than in October. Historically, prices increased about 72% over the time period. The largest decline occurred between October 2008 to April 2009, when prices declined from $1,153 per ton to $712 per ton, decreasing $441 per ton. The largest increase occurred from October 2020 to April 2021, when prices increased from $433 per ton to $695 per ton, increasing $262 per ton. History suggests significant changes are possible in both directions.
Historical changes in prices may not be representative of the conditions currently existing. Fertilizer manufacturers have considerable incentives to bring back production capacities closed by Hurricane Ida. As a result, the current hurricane-induced price increases could decline by spring. However, much will also depend on the winter heating season, and any weather or Covid induced delays that may occur between now and spring.
Should Switch in the Form of Nitrogen Be Considered?
Anhydrous ammonia almost always is the least expensive form of nitrogen. As a result, using ammonia to meet nitrogen needs will result in the lowest per acre costs of nitrogen fertilizer. In most years, using anhydrous ammonia has about $20 per acre lower costs than applying all nitrogen using 28% solution. Current prices are $1,100 per ton for anhydrous ammonia and $475 per ton for 28%. Delivering 170 pounds using anhydrous ammonia will cost $114 per acre compared to $144 per acre for 28%. The difference has widened to $30 per acre ($144 for 28% minus $114 for anhydrous ammonia).
Whether $30 per acre in additional costs justifies a switch from 28% to anhydrous ammonia is a question that each farmer will need to answer. Significant supply problems would result if many farmers decided to switch nitrogen form. On the other hand, the $30 of additional costs may increase the incentive to switch to more soybeans, as discussed in the following question.
Should Switching to More Soybeans Be Considered?
Higher nitrogen prices will increase the costs of corn production and have very little impact on soybean costs, thereby reducing corn profitability relative to soybeans. The increase in fertilizer prices from $800 to $1,100 will increase costs from $89 per acre to $114 per acre, increasing fertilizer costs by $25 per acre. Corn price needs to increase by $.11 per bushel for profitability to be the same, given that corn yields are 220 bushels per acre. That $.11 per bushel does not account for any yield reductions associated with reducing nitrogen applications. The MRTN tool suggests that using ammonia MRTN rates will result in 98% of maximum yield, compared to 99% using corn and ammonia prices that existed in 2020.
Current fall 2021 bids are near $5.00 per bushel for corn and $11.80 for soybeans, causing corn and soybeans to have roughly the same projected profitability in northern and central Illinois (see farmdoc Daily, October 19, 2021, for more discussion of break-even prices). However, further budgeting likely is warranted as market conditions will continue to change.
Corn prices likely will adjust such that corn and soybeans have the same relative profitability if fertilizer prices continue to rise, at least until planting has occurred. Market forces need to adjust prices such that large shifts from corn to soybeans do not occur. After planting, weather and demand conditions will become more important in determining relative price levels. Pre-harvest hedging a portion of 2022 production seems warranted, particularly if some purchases of nitrogen fertilizers have already occurred or at the time of fall nitrogen applications. The current $5.00 fall bids for corn are well above average.
Summary
Higher fertilizer prices will increase costs, reduce recommended nitrogen application rates, and reduce the profitability of corn relative to soybeans. As the price of nitrogen changes, corn and soybean prices will likely adjust to maintain about an equal level of relative profitability of the two crops. Given the high fertilizer costs, applying nitrogen above MRTN rates will become more costly. Focus on the farm’s nitrogen program and considering reducing fertilizer applications should be high priorities at this point.
Reference
Sellars, S., G. Schnitkey, and L. Gentry. “Do Illinois Farmers Follow University-Based Nitrogen Recommendations?” 2020 Agricultural & Applied Economics Association Annual Meeting, Kansas City, MO, July 26-28, 2020. https://ageconsearch.umn.edu/record/304617
Disclaimer: We request all readers, electronic media and others follow our citation guidelines when re-posting articles from farmdoc daily. Guidelines are available here. The farmdoc daily website falls under University of Illinois copyright and intellectual property rights. For a detailed statement, please see the University of Illinois Copyright Information and Policies here.