


Corn and Soybean Markets Shrug Off Bearish USDA Figures
The latest USDA World Agricultural Supply and Demand Estimates released last week on Friday, September 12, contained multiple bearish indicators for US corn and soybean prices. Despite a negative price reaction in the immediate wake of the report release, new-crop corn and soybean futures prices were up on the day. This article considers what this price reversal might imply about market consensus on current supply and demand fundamentals. Generally, corn and soybean prices have been resilient despite elevated levels of negative sentiment around both demand and supply, including the prospect of record US yields for both crops.
All the Bearish News
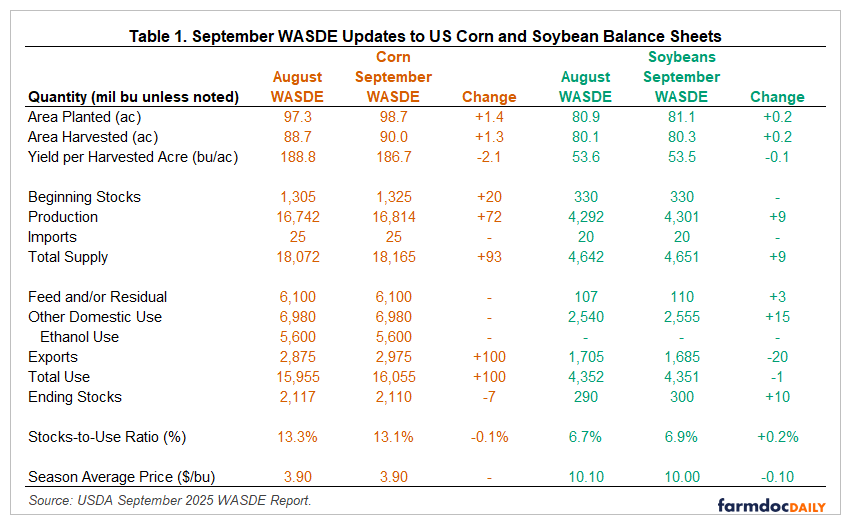
Corn and soybean yield estimates were the most closely watched numbers in the September WASDE report, but USDA updated several items on their US corn and soybean balance sheets shown in Table 1 with most of the changes increasing available supply or decreasing quantity demanded — both bearish for new-crop prices.
Perhaps the most surprising shift was the massive increase in corn acreage. Area planted was increased from 97.3 to 98.7 million acres. While our previous analysis (Franken and Janzen, 2025) of farm program acreage sign-ups did suggest more corn acres than were in the earlier August report, the size of the observed change was unexpected. Soybean acres were also increased from 80.9 to 81.1 million, a smaller but similarly unexpected change.
Yield estimates were reduced as many analysts anticipated, but more acres entirely offset the impact of yield cuts on overall corn production. The observed 2.1 bushel per acre cut in corn yield would typically be viewed as bullish. However, market analysts expected larger decreases for both corn and soybeans, so lower yields may be viewed as negative for price relative to what could have been. Recent dry weather in much of the US Midwest, especially the eastern corn belt, has taken a bite from yield expectations.
More limited changes were seen to corn and soybean use. Soybean export use estimates declined further to reflect the continued absence of demand from China for new-crop US soybeans. Perhaps the only bullish component of the report was the increase in expected corn exports. 2025/26 US corn exports are projected to be nearly three billion bushels, a 100-million-bushel increase from the August report.
On the whole, USDA changed the projected supply and demand balance relatively little with the stocks-to-use ratio declining 0.1 percentage points for corn and increasing 0.2 percentage points for soybeans. Projected stocks-to-use ratios for 2025/26 are not especially burdensome in historical terms. The corn figure is similar to what was projected for 2024/25 one year ago at this time. In September 2024, the projected 2024/25 US stocks-to-use ratio was 13.7% for corn and 12.5% for soybeans.
Price Reaction and Reversal
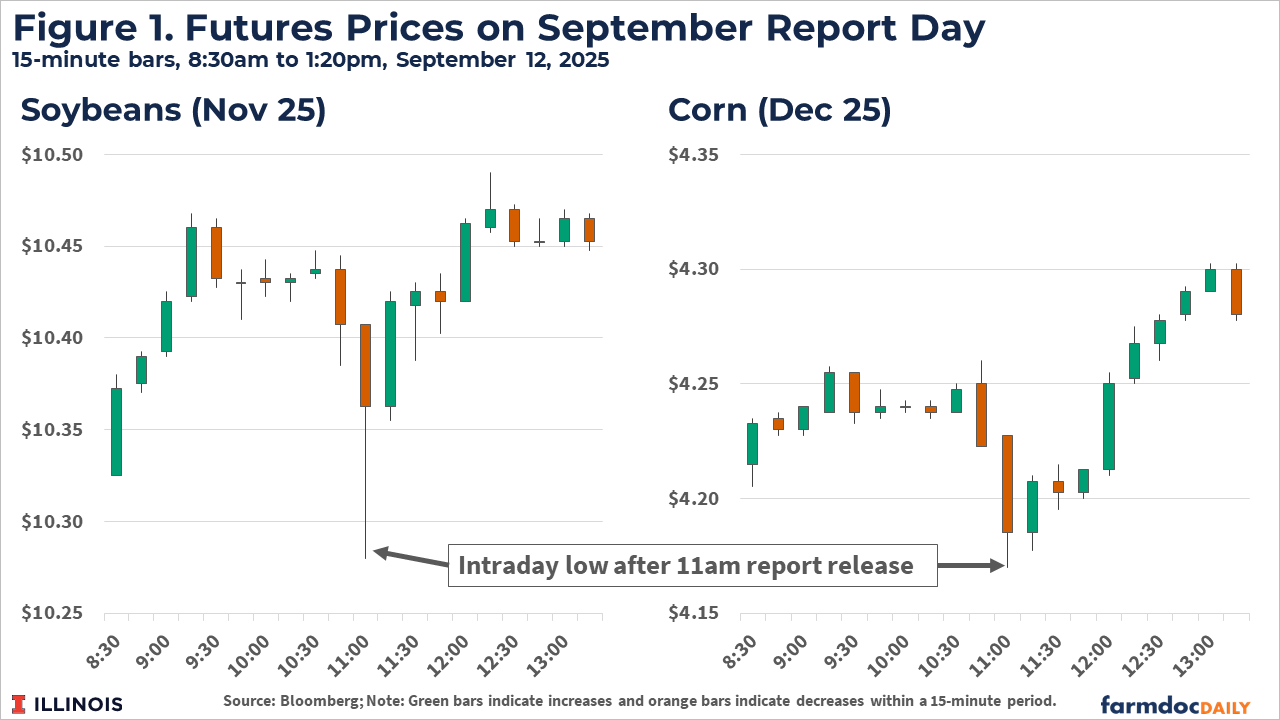
Corn and soybean futures prices reacted negatively to the September WASDE report release. Prices for new-crop futures fell by as much as 6 cents per bushel for corn and 13 cents per bushel for soybeans in the 15-minute period immediately following the report release at 11am US Central Time. Intraday price data for the entire trading day in Figure 1 show December corn futures were 10 cents up from the previous day’s close and November soybean futures were up 13 cents.
The market quickly shrugged off the bearish surprises to acreage, yield, and soybean exports found in the report. The current overall supply and demand picture, as seen in the stocks-to-use numbers, is not especially bearish. Moreover, there seems to be a general feeling that yield estimates have further to fall in the coming months, especially once harvest begins in earnest and yield monitors and harvest grain flow to elevators can begin to quantify some of the speculation on yield.
How frequent are contrasting initial and overall reactions to USDA supply and demand information? To place the September 12 price reversal in some limited context, Figure 2 compares initial and overall price reactions for new-crop 2025 futures contracts on report days since May 2025 when the first 2025/26 WASDE balance sheet was published. In addition to the five WASDE releases, the June 30 Acreage report is also considered. To quantify the initial reaction, I consider the open-to-close price change between 11am and 11:15am. The overall reaction is the difference between the end-of-day settlement price on the report day and the overnight opening price the previous evening.
As one might expect, prices usually move in the same direction around the report release and on the report day overall. The report is typically the biggest supply and demand news on the day it is released and trading volume is elevated in the minutes following the release. Whatever happens in the minutes after the report is likely to be large and likely to dominate other price action on that day.
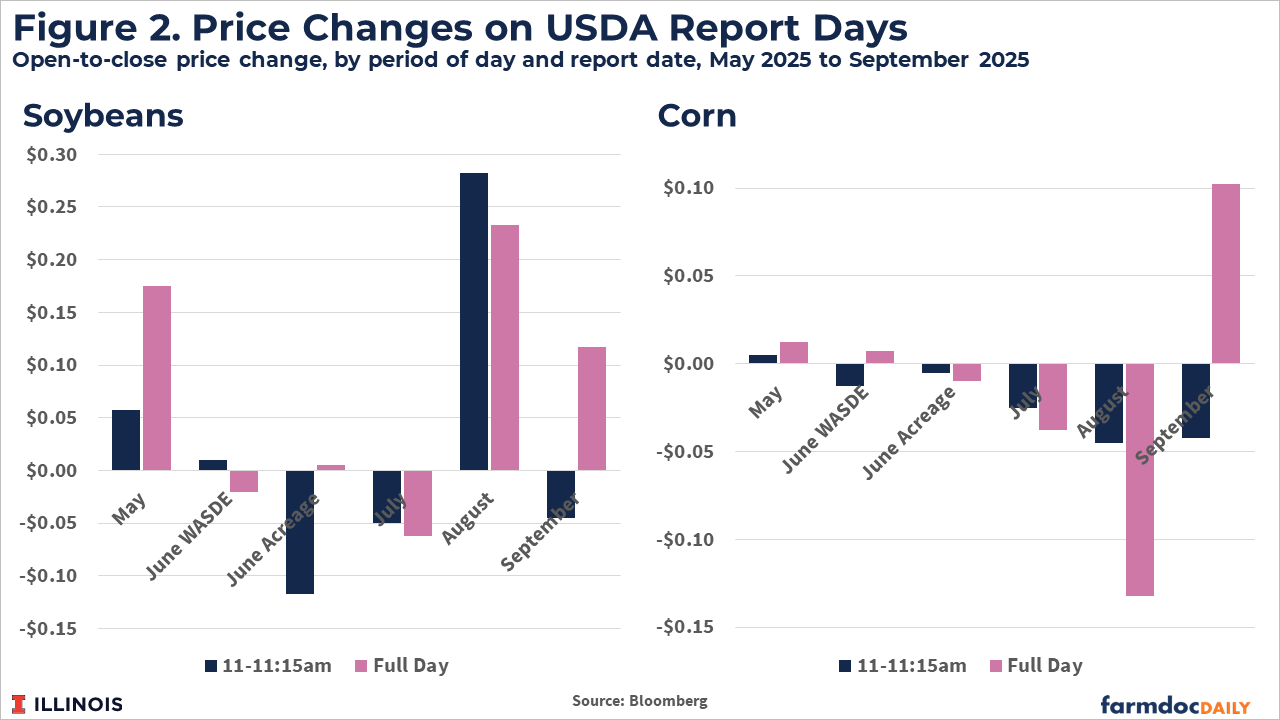
Significant differences between the immediate post-report price reaction and the overall price change on the report day like those observed last week are rare. Other than the most recent WASDE, there are only two exceptions to the idea that post-report-release and overall daily price changes move in the same direction on USDA report days. The first was the June WASDE, where the corn and soybean price reactions were extremely small. The second was the June Acreage report reaction for soybeans where prices fell more than a dime immediately after the report but were up just slightly on the day. In none of these cases was there such a discrepancy between how the market viewed the report at first glance versus its view with some time for further interpretation.
Implications
How should we interpret the contrasting report reactions observed on September 12? It seems clear that the market simply doesn’t view the USDA production data as sufficiently up-to-date, particularly regarding the state of the US corn and soybean crops and their yield prospects in light of recent dry weather. Even the bearish news in the report couldn’t drive prices lower for long. At the same time, no market participant is going to pay higher prices for corn and soybeans now with harvest occurring so soon. The view is that the supply picture, especially the likely-to-be-a-record US crop, which has been viewed as adequate to maintain current price levels could still become burdensome. Big changes to balance sheets and prices may still be in the cards for 2025, even if the most likely outcome remains prices close to current levels.
References
Franken, J. and J. Janzen. "Yes, There Are a Lot of Corn Acres: Evidence from FSA Acreage Data." farmdoc daily (15):149, Department of Agricultural and Consumer Economics, University of Illinois at Urbana-Champaign, August 18, 2025.
U.S. Department of Agriculture, Office of the Chief Economist. "World Agricultural Supply and Demand Estimates." WASDE-664. Washington, DC: USDA, September 12, 2025. https://www.usda.gov/oce/commodity/wasde/wasde0925.pdf
Disclaimer: We request all readers, electronic media and others follow our citation guidelines when re-posting articles from farmdoc daily. Guidelines are available here. The farmdoc daily website falls under University of Illinois copyright and intellectual property rights. For a detailed statement, please see the University of Illinois Copyright Information and Policies here.