


Annual Cost of Storing US Corn and Soybeans Since 1973
This article begins a set of three articles on storing corn and soybeans, a topic of current interest given the size of 2025 US crops (see, for example, Wicks). This article specifically examines long term trends in the cost of storing corn and soybeans. Total storage cost changed little from 1974 through 2005, then moved somewhat higher between 2005 and 2020. Declining interest rates and thus interest opportunity cost of storage mostly offset increasing physical storage costs. Since 2020, interest opportunity cost and physical storage cost have both increased, resulting in higher total storage cost. These storylines underscore the important role of interest rates, thus interest opportunity cost, in offsetting or reinforcing on-going increases in physical storage cost. The reinforcing role has been noticeable since 2020.
Procedures
Starting this study with the 1974 marketing year postdates the increase in price variability that occurred in the early 1970s (Kenyon, Jones, and McGuirk). The study ends with the last complete marketing year, 2024. Cash price is the average monthly price paid to US farmers by first handlers as reported by USDA (US Department of Agriculture), National Agricultural Statistics Service. Storage starts in October, the month with the lowest average cash price. Storage cost includes (a) physical storage cost at commercial facilities to keep the crop in useable condition and (b) interest opportunity cost of storing instead of selling at harvest. Annual physical storage cost is from USDA, Commodity Credit Corporation through the 2005 marketing year. Thereafter, it is for an Ohio country elevator, cross checked with another first delivery point in Ohio. Interest opportunity storage cost is calculated by multiplying (a) the October US cash price times (b) the average one year US Treasury bill rate quoted on an investment basis for October as reported by the Federal Reserve Bank of St. Louis.
Physical storage cost for corn and soybeans varies, usually notably, across different US local markets in a given year due, in part, to different local supply and demand for storage. Moreover, the structure of commercial storage cost for corn and soybeans often varies from year to year. Common structures are (a) a monthly or daily charge per bushel, (b) a monthly or daily charge per bushel plus an upfront charge, and (c) an initial charge for a period of time, for example through January 1, then a monthly or daily charge per bushel. To create a standard format across years, physical storage cost was converted into a cost for the year (i.e. 12 months of storage). Given the notable variations over space, time, and storage cost structure, this article emphasizes longer term trends and relationships.
Corn Storage Cost per Bushel per Year since 1973
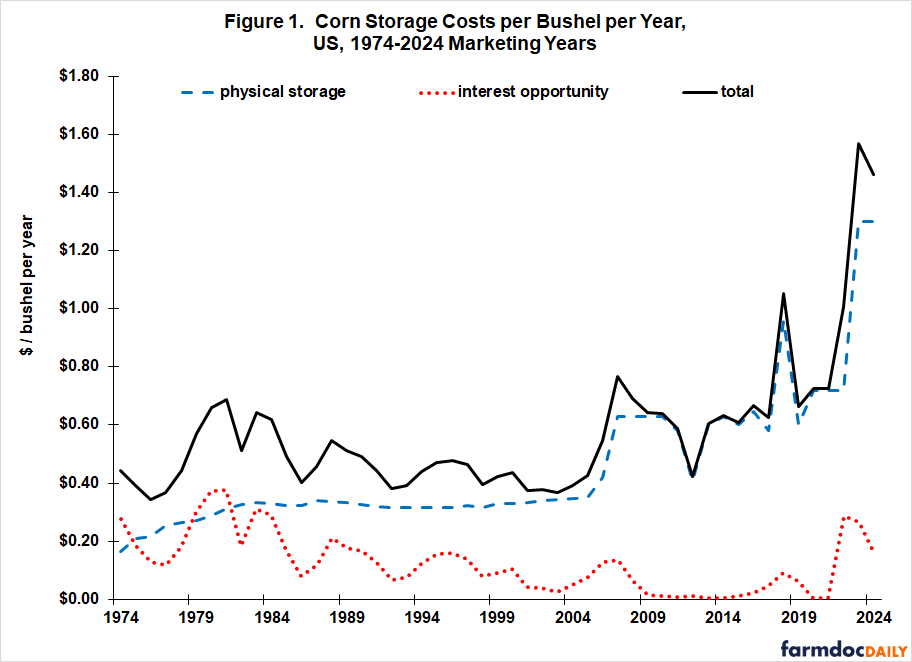
Total storage cost per bushel for US corn changed little between 1974 and 2005. Declining interest rates, thus interest opportunity cost, offset small increases in physical storage cost (see Figure 1). Between 2005 and 2020, a somewhat larger increase in physical storage cost was mostly, but not completely, offset by interest rates and interest opportunity cost approaching zero. Since 2020, both storage cost components have increased, resulting in higher total storage cost.
Soybean Storage Cost per Bushel per Year since 1973
Total storage cost for US soybeans exhibited no trend from 1974 through 2020. Declining interest rates, thus interest opportunity cost, offset increasing physical storage cost, even when physical storage cost increased faster after 2005 (see Figure 2). Since 2020, both physical storage cost and interest opportunity cost have increased, resulting in higher total storage cost.
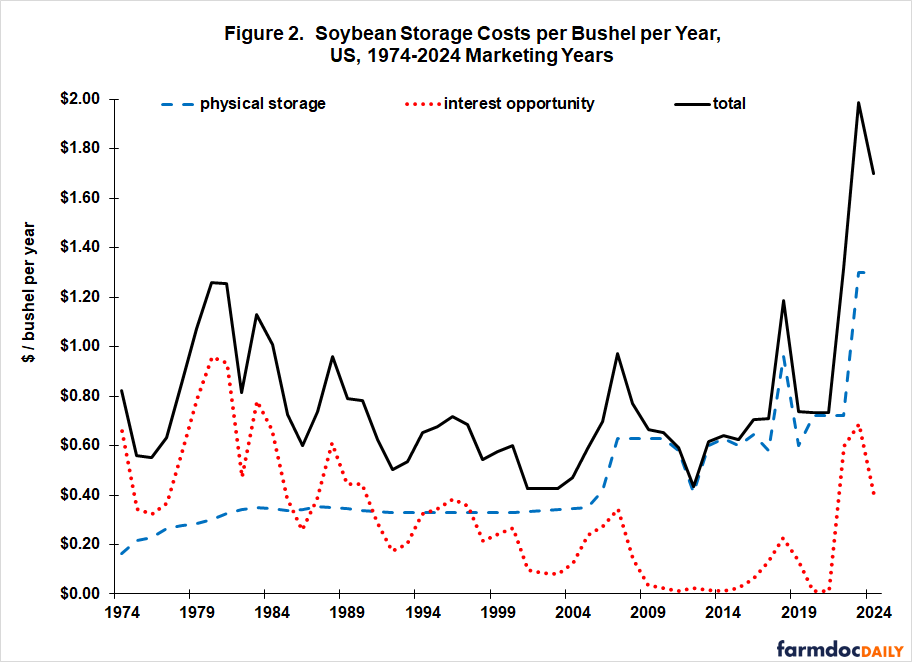
For every year, total storage cost per bushel was higher for soybeans than corn, averaging 37% higher since 1973. The reason is that, while physical storage cost per bushel is usually similar for corn and soybeans, interest opportunity cost per bushel is higher for soybeans due to its price being roughly 2.5 times higher than the price of corn. Total storage cost per bushel for soybeans and corn was most similar during the 2009-2021 marketing years when interest rates were near zero.
Total Annual Storage Cost per Bushel Relative to Harvest Price
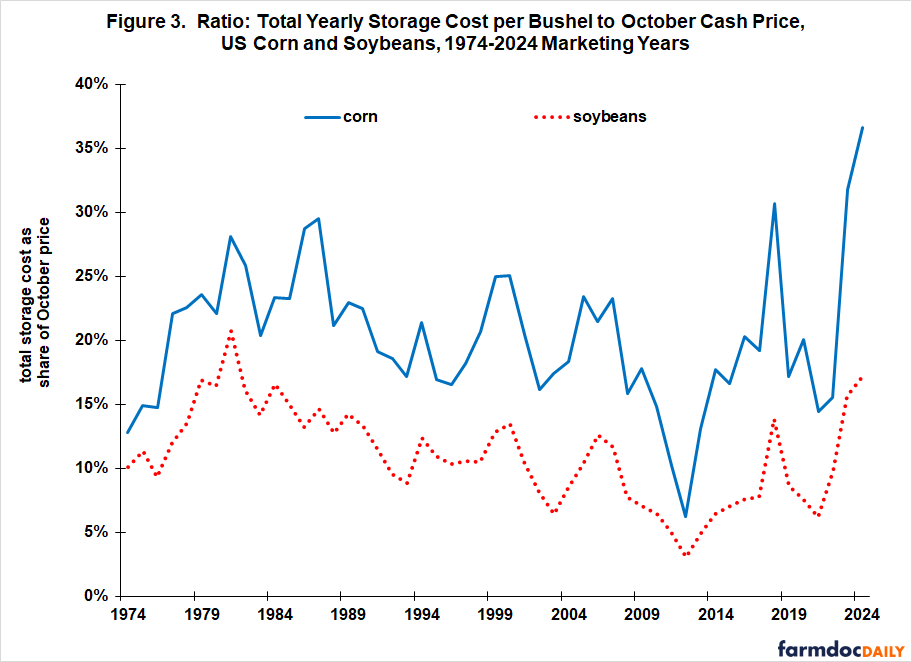
Because both price and storage cost per bushel have increased for corn and soybeans since 1973, it is useful to examine the ratio of total storage cost per bushel to October (i.e. harvest) price. By this measure of total storage cost, soybeans has, on average, been cheaper to store than corn (see Figure 3). The reason is that physical storage cost per bushel is usually larger than interest opportunity cost per bushel while price is roughly 2.5 times higher for soybeans than corn. Relative to October price, total storage cost averaged 20% for corn with a range of 6% (2012) to 37% (2024) vs. 11% for soybeans with a range of 3% (2012) to 21% (1981). The low ratios for 2012 reflect both low interest rates and low physical storage cost per bushel, with the latter reflecting competition among commercial storers for the drought reduced 2012 crop.
Cost to Store One Acre One Year
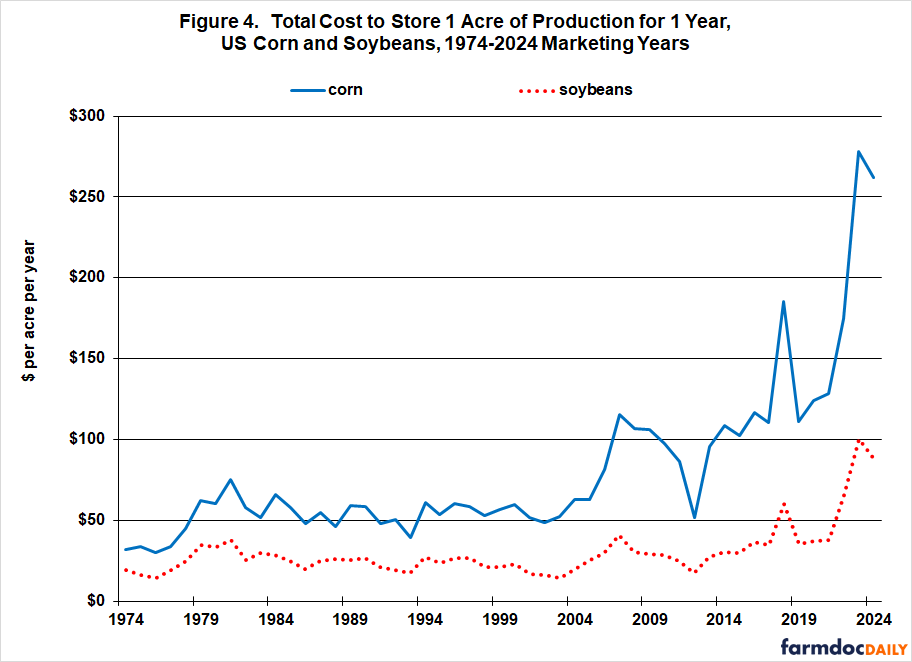
Another perspective is the total cost to store one acre of production for one year. Despite increasing yield per acre, this cost measure barely changed from the late 1970s through 2005 (see Figure 4). It has since move higher as yield increased between 2005 and 2020 and then, after 2020 as both yield and total yearly storage cost per bushel increased.
Summary Discussion
Total storage cost for US corn and soybeans changed little from 1974 through 2005. Declining interest opportunity cost due to declining interest rates offset small, on-going increases in physical storage cost. From 2005 through 2020 and especially for corn, a somewhat larger increase in physical storage cost was mostly, but not completely, offset by an interest opportunity cost that approached zero. Since 2020, physical storage cost and interest opportunity cost have both increased, resulting in higher total storage cost. This storyline largely holds whether total storage cost is measured per bushel, relative to the October harvest price, or per acre of production.
The preceding storyline underscores the important role of interest rates and thus interest opportunity cost in offsetting or reinforcing the on-going increase in physical storage cost. The reinforcing impact has been especially noticeable since 2020.
Since 1973, it has on average been more expensive to store soybeans on a per bushel basis than corn. In contrast, when total storage cost is expressed relative to corn and soybean price, it has been more expensive to store corn than soybeans. These finding may seem at odds but they reflect the interaction of the 2.5 times higher price for soybeans and a usually similar physical storage cost per bushel for corn and soybeans. In short, whether corn or soybeans is cheaper to store, depends on how total storage cost is measured.
The next article in this series will examine the historic net return to storing US corn and soybeans.
References and Data Sources
Barchart.com. August 2025. Futures price data. https://www.barchart.com/
Federal Reserve Bank of St. Louis. September 2025. Federal Reserve Economic Data. https://fred.stlouisfed.org
Ohio Country Elevator. 2006-2024. Annual personal inquiry of corn and soybean storage rates.
US Department of Agriculture, Commodity Credit Corporation. 1974-2007. Annual personal inquiry.
US Department of Agriculture, National Agricultural Statistics Service. October 2025. QuickStats. http://quickstats.nass.usda.gov/
Wicks, N. “Northern Plains Farmers Search for Crop Storage as Prices, Trade Slump.” Agri-Pulse, September 24, 2024. https://www.agri-pulse.com/articles/23505-northern-plains-farmers-search-for-crop-storage-as-prices-trade-slump.
Disclaimer: We request all readers, electronic media and others follow our citation guidelines when re-posting articles from farmdoc daily. Guidelines are available here. The farmdoc daily website falls under University of Illinois copyright and intellectual property rights. For a detailed statement, please see the University of Illinois Copyright Information and Policies here.