Does the Bias in Early Season Crop Condition Ratings for Corn and Soybeans Vary with the Magnitude of the Ratings?
The strong start to the growing season, as indicated by 79 percent of the U.S. corn crop and 73 percent of U.S. soybean crop rated in good or excellent condition on June 18, has many market observers predicting large yields. Previous farmdoc daily articles (May 24, 2017; June 1, 2017; June 13, 2018; June 14, 2018) have emphasized a pattern of bias that is particularly pronounced early in the growing season and the overall limited information these early season crop condition ratings provide. However, the analysis of bias in early season ratings was unconditional. That is, the average bias was computed for all years in the sample without regard to whether the early season ratings were especially high or low. It is possible that the change in the ratings (bias) depends on the starting level of the ratings. The purpose of this article is to analyze the bias in early season crop condition ratings for corn and soybeans conditional on the initial magnitude of the ratings.
Analysis
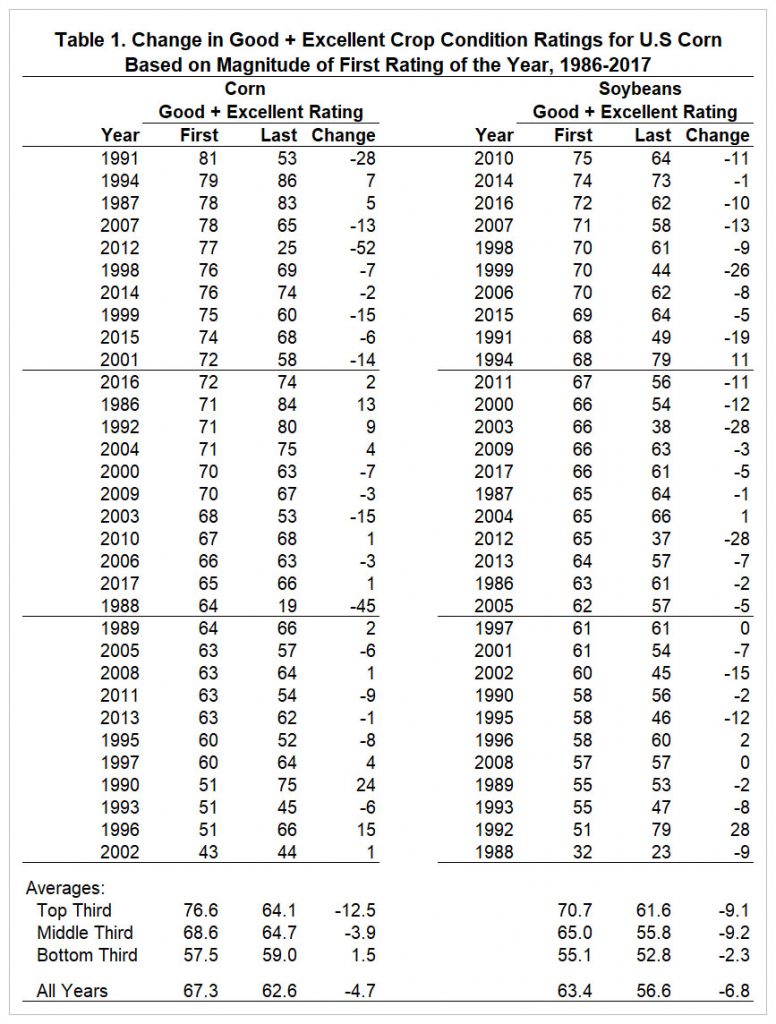
We begin by analyzing the first and last observations for the crop rated in good or excellent condition for corn and soybeans in each crop year available over 1986 through 2017. Table 1 shows the first and last ratings for each crop year and the difference between the two observations. We sort the observations based on the magnitude of the first rating of the season. Note that in the sorting we keep the first and last observations for a given year paired. For instance, the highest first rating for corn occurred in 1991 at 81 percent rated good to excellent. The final rating in 1991 came in at 53 percent leading to a 28 percent point decrease for the year. We then group the observations into thirds based on the magnitude of the first rating in the season. Since there are 32 years in the sample, the top third contains 10 observations, the middle third 11 observations, and the bottom third 11 observations. Arranging the data in this manner allows us to track the average change in condition ratings across a season based on the magnitude of the first rating of the season. The rows at the bottom of Table 1 show the averages of the good and excellent rating observations by thirds as well as the averages across all observations in the sample.

The results in Table 1 show that the change in corn ratings has a marked tendency to decrease when the ratings begin the year at a high level, with the top third of initial corn ratings averaging a decrease of 12.5 points. This compares to an average decrease in corn ratings across all years of 4.7 points. The largest change was in 2012, when good plus excellent ratings dropped a whopping 52 points. It is also noteworthy how consistent the drop in ratings is for years in the top third of highest initial ratings, with ratings for corn decreasing in 8 out 10 years. The two years with high initial ratings and even higher final ratings were 1987 and 1994. The middle third of crop condition ratings show an average 3.9 point decrease from the first rating, slightly lower than the average decrease for all years (4.7 points). The bottom third (or lowest initial ratings) indicate a 1.5 percent increase on average in the good to excellent ratings during the crop year.
Soybean crop condition ratings decrease on average over the crop year regardless of initial rating level. Both the top and middle third of initial soybean ratings decline on average over 9 points during the year and only one year, 2004, witnessed an increase in good and excellent conditions. By comparison, the average change in soybean ratings during the year for the entire period is a decline of 6.8 points. The bottom third of ratings average a 2.3 point decline over the year with 1992 standing out at a 28 percent increase.
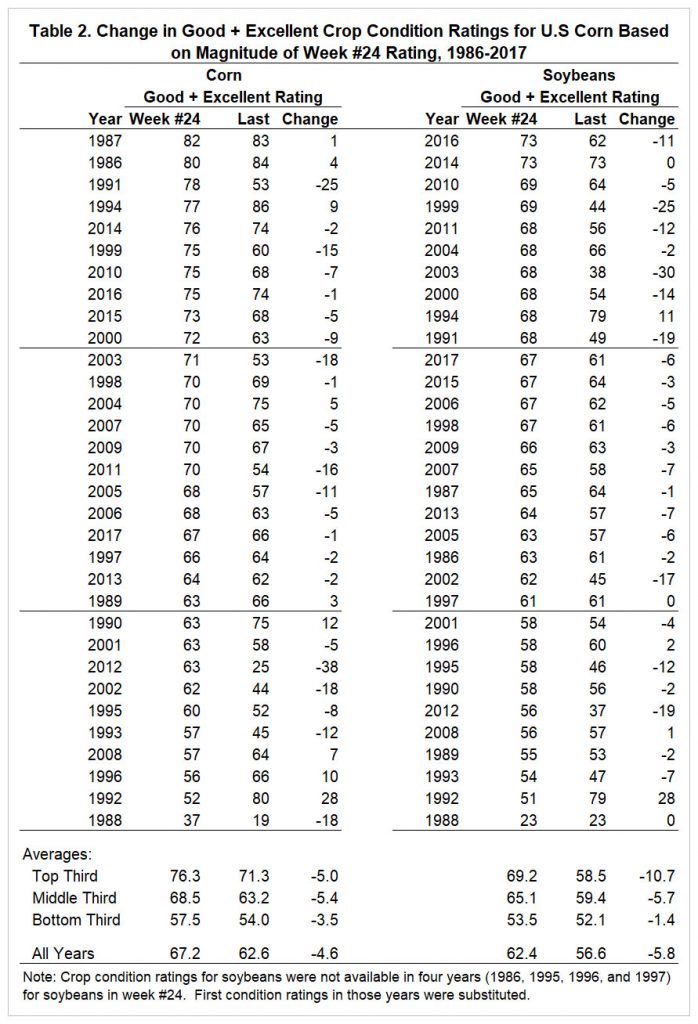
To provide a comparison between the most recent crop conditions report and historical data, Table 2 provides a similar analysis in ranking the good and excellent crop conditions by initial magnitude but ratings for the most recent week (#24) are instead of the first crop condition rating. If week #24 ratings are unavailable for soybeans, the initial rating is used as a substitute. For both corn and soybeans, only five of the years ranked in the top third using first week ranking were still in the upper third by week #24. Despite the shift in rankings, the change in corn ratings continue to show pattern of decreasing ratings when the conditions in week #24 are at a high level. The top third of initial corn ratings average a decrease of 5 points, close to the average decrease in corn ratings across all years of 4.6 points. Week #24 ratings in the top third decrease 70 percent of the time. The middle third of crop condition ratings show an average of a 5.4 point decrease from the week #24 rating, while the bottom third (or lowest initial ratings) indicate a 3.5 percent decrease on average in the good to excellent ratings.

The results in Table 2 show that soybean crop condition ratings once again decrease on average from the week #24 rating over the crop year regardless of initial rating level. The decrease for the top third of years is 10.7 points, substantially larger than the average of 5.8 points for all years. The middle third of years average a decrease of 5.7 points while the bottom third of ratings average a 1.4 point decline.
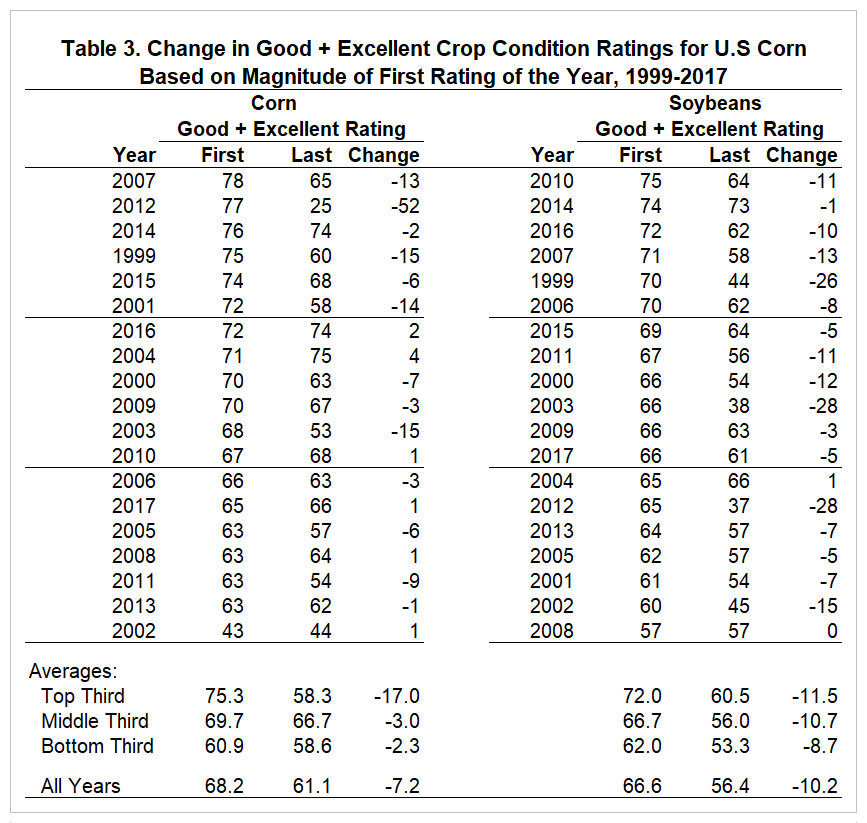
In our previous farmdoc daily articles (May 24, 2017; June 1, 2017; June 13, 2018; June 14, 2018) related to crop condition ratings, we found a structural change in bias associated with the early season crop season ratings for both corn and soybeans after 1999. It is possible that this structural change in the bias across all years carries over to the highest and lowest initial ratings. Table 3 provides an analysis using first and last observations of corn and soybean good and excellent crop ratings from 1999 – 2017. The period is once again separated into thirds based on the magnitude of the first rating of the crop year. The top third of corn ratings averages an even larger 17 point decline in the truncated sample, consistent with the larger overall bias after 1999. Furthermore, the highest third of first good to excellent ratings for corn decrease in 6 out 6 years. The average change in corn ratings over the crop year for the all years over 1999-2017 is 7.2 points lower. Soybean crop condition ratings in the truncated sample decrease on average over the crop year regardless of initial rating level and only one year, 2004, indicates an increase in ratings over the crop year. The top third of soybean ratings decline on average 11.5 points. The middle third of ratings declines on average by 10.7 points by the end of the crop year and the bottom third of ratings average an 8.7 point decline over the year.

Implications
After a rocky start in April, the U.S. growing season for corn and soybeans in 2018 has since gone about as well as one could hope. This is reflected in historically high crop condition ratings and considerable discussion about the potential for record yields. The analysis in this article suggests that some of the enthusiasm about yield potential may need to be tempered. We analyzed the average change across the season in good plus excellent condition ratings for corn and soybeans based on the level of early season ratings. Corn ratings have a marked tendency to decrease when the ratings begin the year at a high level, with the top third of initial corn ratings averaging a decrease of 12.5 points. The decline is also consistent, with ratings for corn in the top third of years decreasing 80 percent of the time. Both the top and middle third of initial soybean ratings decline an average of 9 points, and only one year in these 2 groups witnessed an increase in good and excellent conditions.
In sum, history suggests there is a strong probability that the high corn and soybean ratings of recent weeks will decline as we go through the remainder of the 2018 growing season. A conservative estimate of the magnitude of the decline is 5-10 points for both corn and soybeans. There is, of course, a chance for ratings to stay at current elevated ratings or even increase. This has happened a few times in the past, such as 1987 and 1994 for corn. However, the chance of this happening is low because the odds of having excellent weather conditions for an entire growing season in the U.S. Corn Belt are low.
References
Irwin, S., and D. Good. "When Should We Start Paying Attention to Crop Condition Ratings for Corn and Soybeans?" farmdoc daily (7):96, Department of Agricultural and Consumer Economics, University of Illinois at Urbana-Champaign, May 24, 2017.
Irwin, S., and D. Good. "How Should We Use Within-Season Crop Condition Ratings for Corn and Soybeans?" farmdoc daily (7):101, Department of Agricultural and Consumer Economics, University of Illinois at Urbana-Champaign, June 1, 2017.
Irwin, S., and T. Hubbs "What to Make of High Early Season Crop Condition Ratings for Corn?" farmdoc daily (8):108, Department of Agricultural and Consumer Economics, University of Illinois at Urbana-Champaign, June 13, 2018.
Irwin, S., and T. Hubbs. "What to Make of High Early Season Crop Condition Ratings for Soybeans?" farmdoc daily (8):109, Department of Agricultural and Consumer Economics, University of Illinois at Urbana-Champaign, June 14, 2018.
USDA, National Agricultural Statistics Service. Crop Progress (June 18, 2018). http://usda.mannlib.cornell.edu/usda/nass/CropProg/2010s/2018/CropProg-06-18-2018.pdf
Disclaimer: We request all readers, electronic media and others follow our citation guidelines when re-posting articles from farmdoc daily. Guidelines are available here. The farmdoc daily website falls under University of Illinois copyright and intellectual property rights. For a detailed statement, please see the University of Illinois Copyright Information and Policies here.


