


Public Perception of USDA Spending: Gardner Survey Results, Part 4
The US Department of Agriculture funds a wide range of programs in the food and agricultural system – from food assistance to crop insurance. Most of USDA’s programmatic budget (80%) is mandatory, required in statutory provisions reauthorized roughly every five years by Congress in farm bills (USDA, 2021). Among the many voices heard throughout a farm bill reauthorization debate are those of consumers. To better understand public perception of agricultural and food policy, including USDA spending allocations, we initiated the Gardner Food and Agricultural Policy Survey, a quarterly online survey of approximately 1,000 Americans (farmdoc daily, June 2, 2022).
We asked participants to think about USDA spending in two ways. First, we asked participants to think about the entire USDA budget. In this exercise, we asked participants to allocate $100 dollars across the USDA main budget categories. In the second exercise, we asked participants to think more about the allocation of funding for farm support programs specifically. Here, we asked participants to allocate $100 across different commodity groups (e.g., dairy, livestock, field crops) that would be eligible for farm support programs.
Budget Allocations Across USDA Categories
We asked participants, “Suppose the USDA gave you $100 to divide among its six budget categories. How much money would you give to each category?” Participants allocated the money across six budget categories:
- Farm Support – includes farm and commodity programs (direct payments, price supports), crop insurance fund, etc.
- Food Assistance – includes the Supplemental Nutrition Assistance Program (SNAP), Women, Infants, and Children (WIC), National School Lunch Program (NSLP), etc.
- Food Safety and Inspection – includes Food Safety and Inspection Service, Animal, Plant, and Grain Inspection, etc.
- Natural Resources and Environment – includes Natural Resource Conservation Service, National Forest System, etc.
- Research and Education – includes Agricultural Research Service, cooperative state research, education, and extension, etc.
- Rural Development – includes loans and grants for rural utilities, housing, and businesses
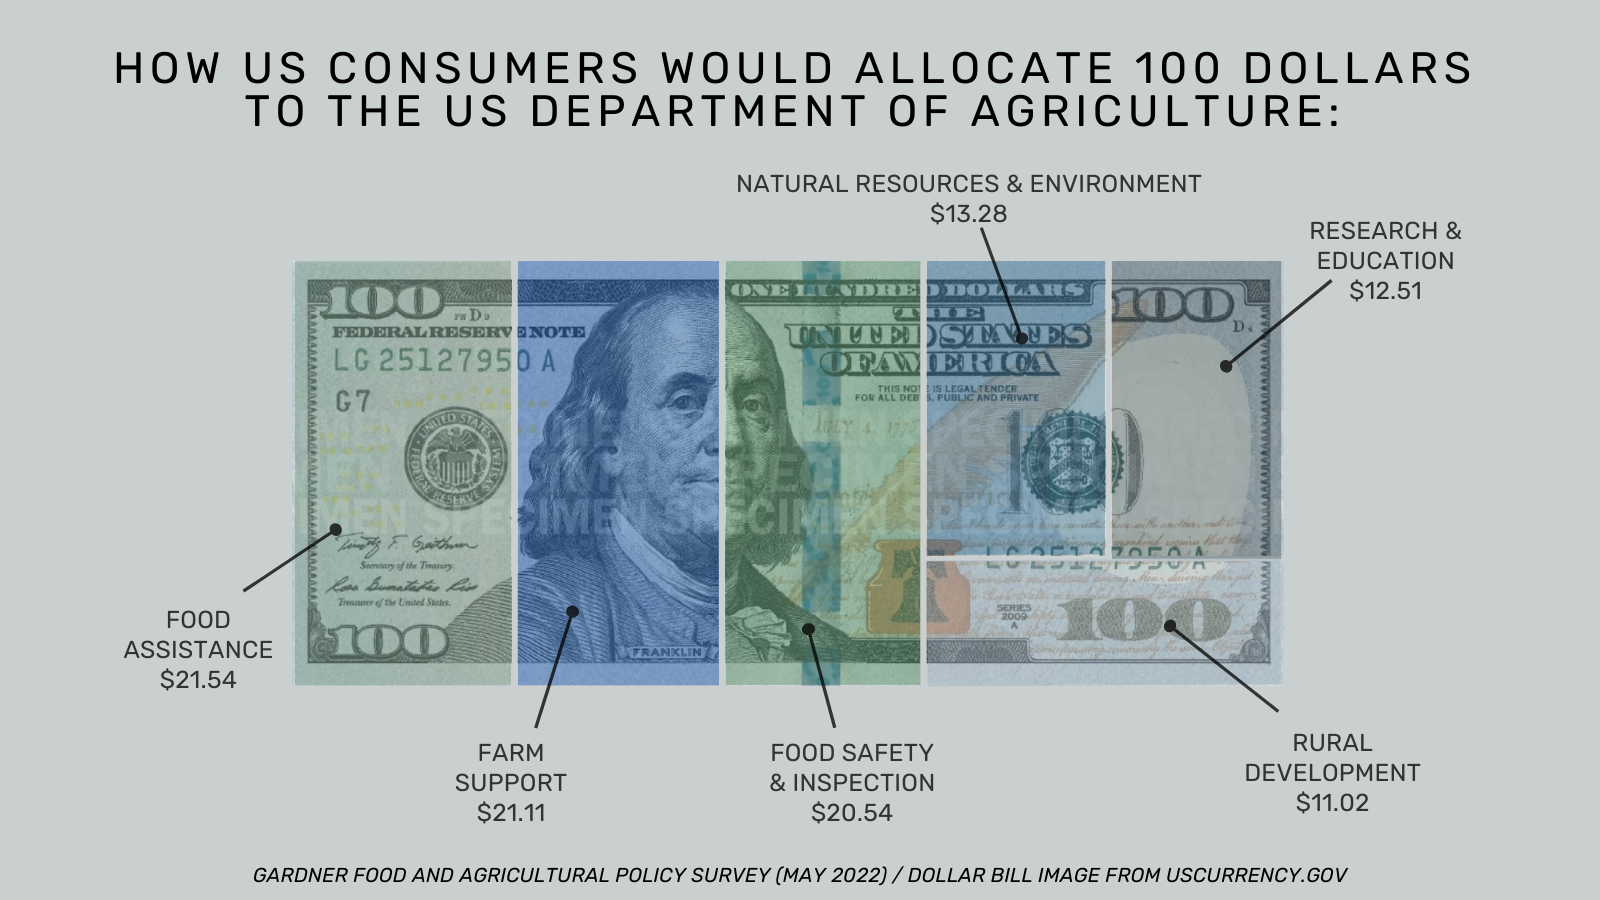
Our results indicate that participants allocated the highest amount ($21.54) to food assistance closely followed by farm support ($21.11) and food safety and inspection ($20.54). Participants allocated an average of $13.28 to natural resources and environment, $12.51 to research and education, and $11.02 to rural development. Results are depicted in Figure 1.
Figure 1. Average responses by US consumers to the question, “Suppose the USDA gave you $100 to divide among its six budget categories. How much money would you give to each category?”
The public’s suggested allocations differ considerably from actual allocations of the USDA budget. In particular, the public allocated much less to food assistance than is spent on the category, as mandated by Congress. The USDA currently spends 65% of its total budget on food assistance (USDA, 2021). Other categories differ considerably as well. For example, research and education makes up about 2.3% of the 2021 USDA budget while food safety and inspection comprises less than 1% (USDA, 2021).
Other studies have also investigated the public’s perceptions of and preferences for USDA spending. Ellison and Lusk (2011) asked consumers the same budget allocation question in 2009; consumers in our 2022 survey preferred to allocate about $10 less, on average, to food safety and inspection and re-allocated those funds across the other budget categories. The categories that received the largest gains were farm support and rural development. Ellison and Lusk (2011) also found that informing consumers of the actual USDA budget allocations altered their allocations slightly, yet the public’s allocations remained far from actual spending. More recently, Lusk and Polzin (2022) asked consumers whether they would like to see more, less, or the same amount of funding for each USDA budget category. In general, over 1/3 of consumers wanted to see more spending for each category, with food safety and inspection receiving the largest share of support for increased spending (53%).
Budget Allocations Across Commodities
As discussed above, one component of the USDA budget is farm support. In this question, we asked participants how they would divide up farm support dollars between different commodity groups. Specifically, “You have been given $100 to provide support to farms that grow these different types of commodities. How much would you give to each commodity group?” The options were:
- Field crops (corn, wheat, soybeans, rice)
- Livestock (cattle, hogs, poultry)
- Dairy (milk)
- Specialty crops (fruits, vegetables, nuts)
- Textile crops (cotton, wool)
- Sugar crops (sugar beets, sugarcane).
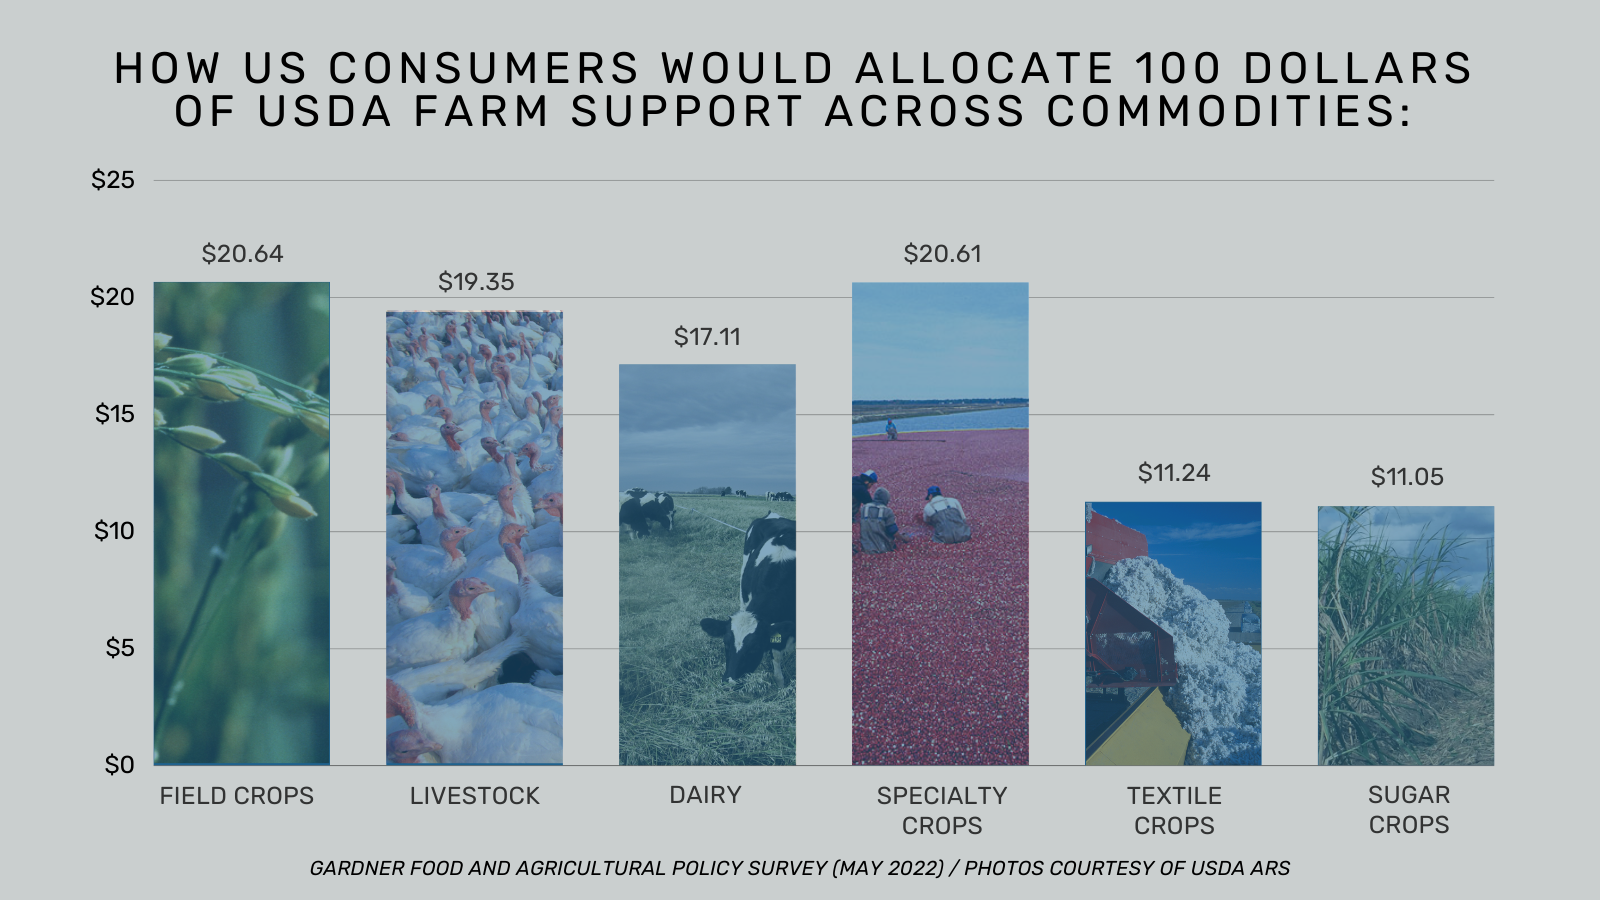
Figure 2 presents the average allocations by commodity. We find that the public allocated the highest amounts to field crops ($20.64), followed by specialty crops ($20.61), and livestock ($19.35). Lower amounts were allocated to dairy ($17.11), textile crops ($11.24), and sugar crops ($11.05).
Figure 2. Average responses by US consumers to the question, “You have been given $100 to provide support to farms that grow these different types of commodities. How much would you give to each commodity group?”
The public’s allocation differs substantially from actual allocations, which tend to support field crops more heavily. Although the USDA’s budget can be quite confusing, with its many programs, accounts, and categories, we can attempt to compare these allocations. For example, combining the amounts spent for major crops through the Commodity Credit Corporation (CCC) in the 2021 fiscal year ($6.98 billion) with the amounts spent for Noninsured Crop Disaster Assistance Program (used for specialty crops, which do not have crop insurance programs) in the same year ($118 million), we can calculate the proportion of these dollars allocated to each commodity (CBO May 2022; FSA 2022).Using the same $100 framework, USDA spent $63.13 on field crops, $10.64 on dairy, and $15.46 on cotton (representing the textile category). In addition, standing disaster programs funded by the CCC and authorized in the farm bill (i.e., excluding the ad hoc programs such as the Market Facilitation Program or the Coronavirus Food Assistance Program) provide direct assistance for livestock losses at $9.10 by this measure, but also fund some specialty crop losses from disaster. Finally, NAP spending would be roughly $1.66 by this measure. CBO reports no cost for the sugar program, which operates through a loan and allotment system to keep prices above the loan rate.
Allocations for commodities differed across census regions (Northeast, South, Midwest, and West). Results are presented in Table 1. Differences across region appear to be somewhat related to crops grown near consumers. Consumers tended to allocation additional funds to commodity types more common in their region, perhaps due to increased familiarity with the commodity, a regional importance, or a desire to support local farmers.
Table 1. Average Allocations By Commodity Across Regions
| Northeast | South | Midwest | West | |
| Field Crops | $19.94 | $19.79 | $21.25 | $22.96 |
| Livestock | $19.19 | $20.12 | $18.72 | $18.5 |
| Dairy | $18.28 | $17.04 | $17.87 | $14.51 |
| Specialty Crops | $21.07 | $19.9 | $20.43 | $22.09 |
| Textile Crops | $11.12 | $11.46 | $11.09 | $11.06 |
| Sugar Crops | $10.41 | $11.68 | $10.65 | $10.89 |
Consumers in the South allocated higher amounts to sugar crops, textile crops, and livestock. Southern states are the nation’s largest producers of sugar cane (although sugar beets are grown in other regions) (USDA ERS, 2021); leading cotton-producing states (USDA ERS, 2022); and Texas accounts for a large portion of cattle production (USDA NASS, 2022). Similarly, consumers in the West allocated higher amounts to specialty crops and field crops. California is an extremely large producer of specialty crops (USDA Climate Hubs) – from vegetables to nuts – and rice (a field crop mentioned in the survey) (USDA ERS, 2022). Consumers living in the Midwest also allocated higher amounts to field crops. The Midwest produces much of the US’s supply of corn (USDA ERS, 2022) and soybeans (USDA ERS, 2022), is a large producer of wheat (USDA ERS, 2022), and produces rice (USDA ERS, 2022).
Interestingly, this relationship did not hold for dairy. The Northeast, Midwest, and South allocated much higher amounts to dairy than did the West, despite much of the nation’s milk production is concentrated in California. Other major producing states are Wisconsin, Idaho, New York, and Texas (USDA ERS, 2022).
Concluding Thoughts
Results from the Gardner Food and Agricultural Policy Survey indicate there are large differences between actual and preferred USDA budget allocations. Importantly, although the public is an important and undervalued voice in the debate, they may be less informed about each budget item or its implications. For example, the average consumer believes the USDA extremely underinvests in food safety and inspection, yet it is unclear if consumers are considering that the Food and Drug Administration also invests in and has oversight of food safety for non-commodity food products. It is useful to weigh public perception with other stakeholders in the food and agricultural system. Farm Bill debates, moreover, may offer opportunities for stakeholders to engage the public – both to improve understanding of agricultural needs and in listening to the public’s priorities.
References
Kalaitzandonakes, M.; Ellison, B.; and Coppess, J. 2022. "Introducing the Gardner Food and Agricultural Policy Survey." farmdoc daily (12):81, Department of Agricultural and Consumer Economics, University of Illinois at Urbana-Champaign.
Lusk, J. and Polzin, S. 2022. “Consumer Food Insights.” Center for Food Demand Analysis and Sustainability. 1(3). https://ag.purdue.edu/cfdas/wp-content/uploads/2022/04/Report_03-2022.pdf
United States Department of Agriculture (USDA). 2021. “Fiscal Year 2021 Budget Summary.” https://www.usda.gov/sites/default/files/documents/usda-fy2021-budget-summary.pdf
United States Department of Agriculture Climate Hubs. “Specialty Crops in California.” https://www.climatehubs.usda.gov/hubs/california/topic/specialty-crops-california#:~:text=Many%20of%20California's%20specialty%20crops,variety%20of%20climate%2Drelated%20challenges.
United States Department of Agriculture Economic Research Service (USDA ERS). 2022. “Cotton Sector at a Glance.” https://www.ers.usda.gov/topics/crops/cotton-wool/cotton-sector-at-a-glance/
United States Department of Agriculture Economic Research Service (USDA ERS). 2022. “Feedgrains Sector at a Glance.” https://www.ers.usda.gov/topics/crops/corn-and-other-feedgrains/feedgrains-sector-at-a-glance/
United States Department of Agriculture Economic Research Service (USDA ERS). 2022. “Oil Crops at a Glance.” https://www.ers.usda.gov/topics/crops/soybeans-oil-crops/oil-crops-sector-at-a-glance/
United States Department of Agriculture Economic Research Service (USDA ERS). 2022. “Rice Sector at a Glance.” https://www.ers.usda.gov/topics/crops/rice/rice-sector-at-a-glance/
United States Department of Agriculture Economic Research Service (USDA ERS). 2022. “Wheat Sector at a Glance.” https://www.ers.usda.gov/topics/crops/wheat/wheat-sector-at-a-glance/
United States Department of Agriculture Economic Research Service (USDA ERS). 2021. “U.S. Sugar Production.” https://www.ers.usda.gov/topics/crops/sugar-sweeteners/background/
United States Department of Agriculture Economic Research Service (USDA ERS). 2022. “Dairy: Background.” https://www.ers.usda.gov/topics/animal-products/dairy/background/
United States Department of Agriculture National Agricultural Statistic Services (NASS). 2019. “Cattle.” ISSN: 1948-9099. https://downloads.usda.library.cornell.edu/usda-esmis/files/h702q636h/pn89f870n/jw828f69f/catl0122.pdf
Disclaimer: We request all readers, electronic media and others follow our citation guidelines when re-posting articles from farmdoc daily. Guidelines are available here. The farmdoc daily website falls under University of Illinois copyright and intellectual property rights. For a detailed statement, please see the University of Illinois Copyright Information and Policies here.