


Planted Acres and Private Market Profitability over the Current Crop Safety Net Period
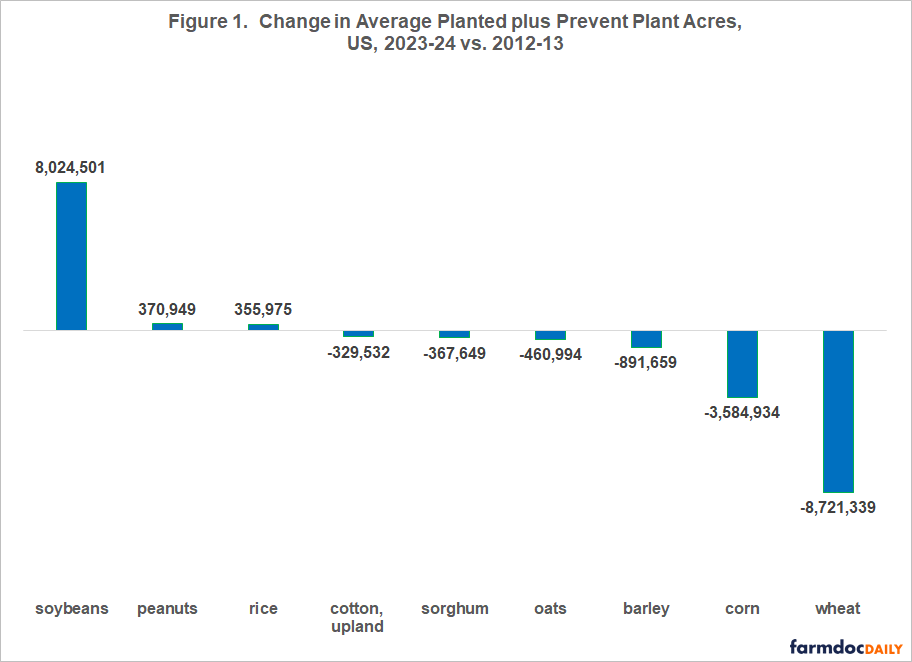
Decisions to plant or not plant a crop is the ultimate indicator of a crop’s profitability. An increase in acres over a span of years indicates the crop is profitable relative to other farm and nonfarm uses of the land. A decrease indicates the crop is unprofitable relative to other uses. Between 2012-13 and 2023-24, a period associated with the current US crop safety net; planted plus prevent planted acres increased for soybeans, peanuts, and rice, implying relative profitability (see Figures 1 and 2). Acres declined for corn, upland cotton, sorghum, barley, oats, and wheat. The double digit percent decline for the last three crops clearly implies unprofitability. Percent decline for corn, upland cotton, and sorghum is small enough that caution is used in assessing the implied profitability of these three crops.
The crops in Figures 1 and 2 are the farm program crops for which USDA, ERS (US Department of Agriculture, Economic Research Service) computes a cost of production and net return to production at harvest. Crop years 2012 and 2013 are the two years that precede the current crop safety net. Crop years 2023 and 2024 are the latest two years. Two year averages are used to smooth some factors that impact plantings, including rotations. Prevent planted acres are included because weather can impact planted acres in a given year. Planted acres are from QuickStats (USDA, NASS (National Agricultural Statistical Service). Prevent plant acres are from USDA, FSA.

Percent Acre Change and Private Market Return
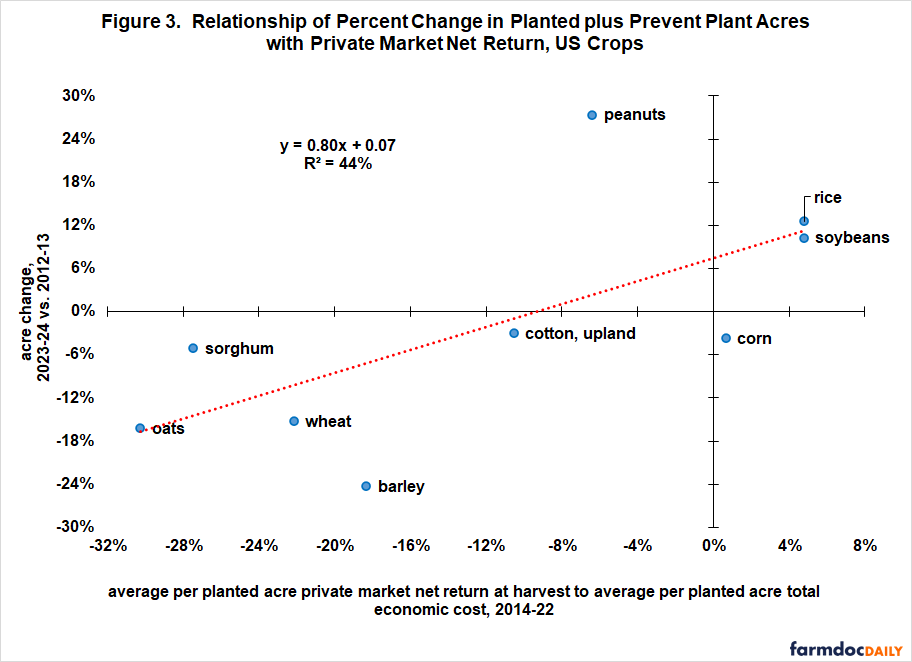
Economic principles imply that private market return to production should be positively related to changes in planted acres. This expected positive relationship exists between the percent changes in acres from 2012-13 to 2023-24 in Figure 2 and the crop’s average private market rate of return to cost of production at harvest over the intervening period of 2014-2022 (see Figure 3). Rate of return is calculated using USDA, ERS (Economic Research Service) cost of production data (see Data Note 1). The relationship in Figure 3 is significant with 97% statistical confidence. However, private market net return across the nine crops explains less than half (44%) of the percent change in acres across the crops.
Discussion
A farmer’s decision to plant or not plant a crop is the ultimate indicator of the crop’s profitability.
Since the 2014 Farm Bill created the current crop safety net, planted plus prevent planted acres have increased for peanuts, rice, and soybeans among the nine program crops for which USDA computes cost of production. Acres of the other six crops have declined.
While statistically significant in accordance with economic principles, private market net return explains less than half of the variation in percent change of acres for the nine cost of production crops between 2012-13 and 2023-24.
Variables in addition to private market net return are thus needed to fully explain the observed change in acres since 2014. We will continue this investigation in forthcoming articles.
Data Note 1: ERS Cost and Return
USDA, ERS calculates an economic cost to produce barley, corn, cotton, oats, peanuts, rice, sorghum, soybeans, and wheat. All inputs except management needed to plant, harvest, and get the crop in suitable condition for storage are assigned a cost. The inputs include unpaid labor and farmer-owned land, which are assigned an opportunity cost. Quantity of each input is based on periodic surveys of farms. Price of each input is updated annually using USDA, NASS data.
USDA, ERS also calculates a gross value of production and a net return to production. Gross value includes income from both a crop’s primarily product, such as grain and cotton lint, and secondary product(s), such as straw and cottonseed. Price of the product is determined for the crop’s harvest period. Returns to production do not include government payments, crop insurance indemnities, and returns to storage. Costs do not include cost of storage and crop insurance. The net return that USDA, ERS calculates is thus a private market net return at harvest.
Economic cost of production per planted acre for the 2014 through 2022 crop years are averaged for a crop. Net returns per planted acre over 2014-22 are also averaged. A percent rate of return on economic cost is computed by dividing average net return by average cost.
References and Data Sources
US Department of Agriculture, Economic Research Service. January 2025. Cost of Production. https://www.ers.usda.gov/data-products/commodity-costs-and-returns/
US Department of Agriculture, Farm Service Agency. January 2025. Crop Acreage Data. https://www.fsa.usda.gov/tools/informational/freedom-information-act-foia/electronic-reading-room/frequently-requested/crop-acreage-data
US Department of Agriculture, National Agricultural Statistics Service. January 2025. QuickStats. https://quickstats.nass.usda.gov/
Disclaimer: We request all readers, electronic media and others follow our citation guidelines when re-posting articles from farmdoc daily. Guidelines are available here. The farmdoc daily website falls under University of Illinois copyright and intellectual property rights. For a detailed statement, please see the University of Illinois Copyright Information and Policies here.