


US Corn, Soybean, and Wheat Acres in the Planting Flexibility Era
The 1990 Farm Bill began allowing US farmers to make planting decisions not constrained by government programs (USDA (US Department of Agriculture), December 1990). A “Flex Acre” provision gave farmers the freedom to plant crops other than the designated crop on a base acre without losing the base acre. Flex acres, which were 15% of base acres, were ineligible for commodity program payments. Fruits and vegetables were excluded as planting options. The 1996 Farm Bill extended planting flexibility to all base acres (payment acre reduction remained 15%) (USDA, September 1996). This article documents the importance of planting flexibility for US corn, soybean, and wheat acres, including state level changes. Findings include (1) that the ethanol boom has not impacted the long-term increase in either corn or soybean acres, (2) that smaller acreage states play a larger role in US corn than US soybeans and (3) that corn has shifted more west than north while soybeans has shifted more north than west.
National Perspective on Planting Flexibility
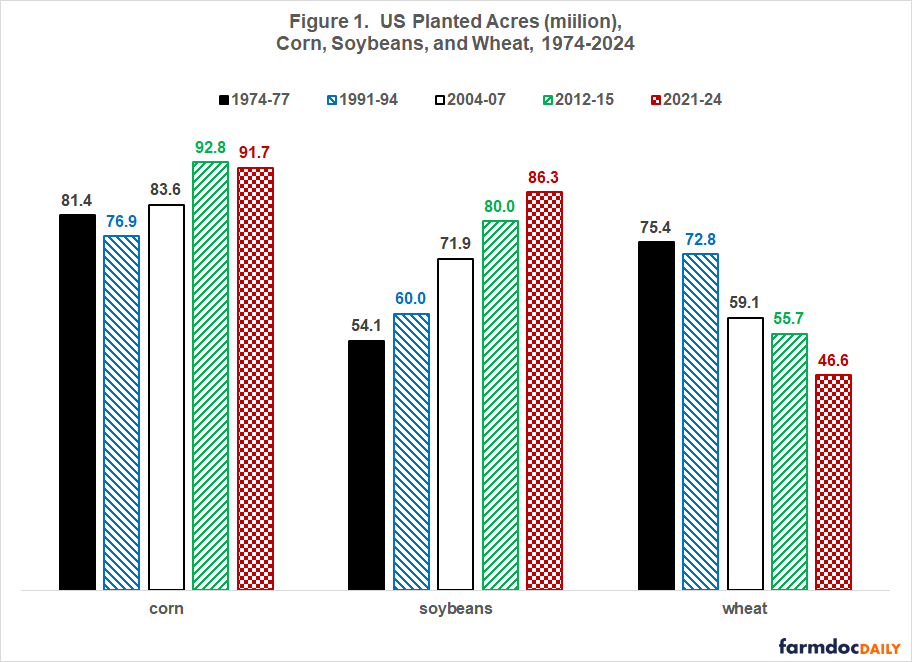
Using data from QuickStats (USDA, National Agricultural Statistics Service), Figure 1 presents average acres planted to US corn, soybeans, and wheat in five 4-year periods. The first, 1974-77, marks the beginning of higher price volatility due in part to ending continuous acreage controls. The second, 1991-94, marks the advent of planting flexibility. The third, 2004-07, marks the start of a multi-year period of crop prosperity associated with rapid growth in ethanol production. The fourth, 2012-15, marks the end of the prosperity period and rapid ethanol expansion. The fifth, 2021-24, is the last four crop years. Soybean acres were higher in each succeeding 4-year period, while wheat acres were lower. Corn acres trended up, but erratically.
Other changes are difficult to assess using Figure 1 because the number of years between successive periods varies. Figure 2 therefore presents the average annual change per year between consecutive periods, and adds the change from 2004-07 to 2021-24. Annual change was smallest for soybeans and wheat and next smallest for corn during the 1974-77 to 1991-94 period, the period that preceded planting flexibility (black bars, Figure 2). The larger changes after the early 1990s shows that planting flexibility notably impacted US crop agriculture (a) by increasing responsiveness to changes in the market and (b) by making planting a more important management decision.
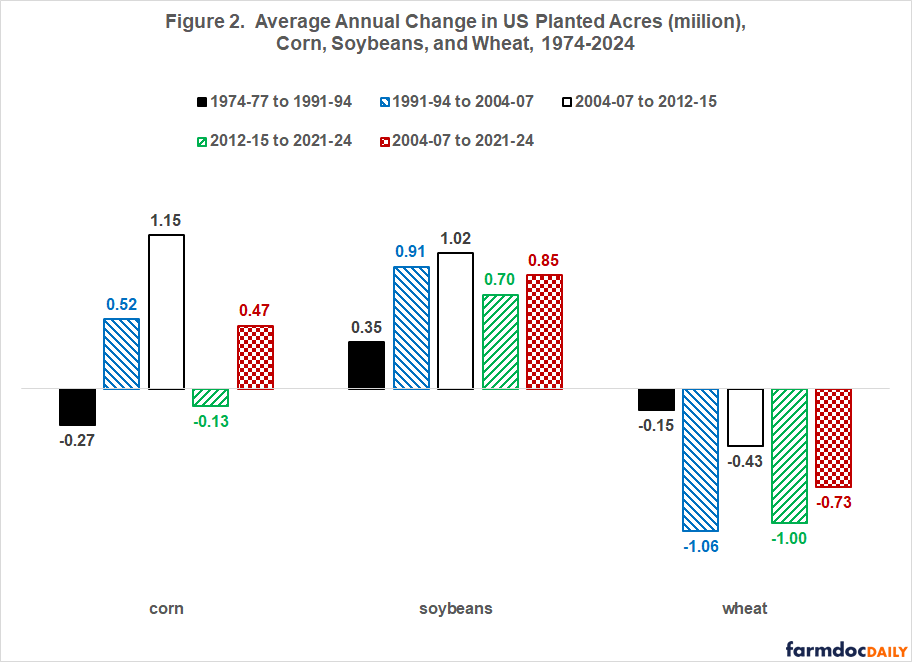
The erratic path of corn planted acres deserves discussion. Unsurprisingly, corn acres increased the most during the 2004-07 to 2012-15 period of rapid ethanol expansion (an average of +1.15 million acres annually). Since then, corn acres have declined by -0.13 million per year on average. This decline has offset the rapid increase. Average annual change is nearly identical for 1991-94 to 2004-07 and for 2004-07 to 2021-24 (+0.52 vs. +0.47 million). The similarity implies that, so far, the ethanol boom has not altered the long term rate of increase in corn acres during the planting flexibility era. Ethanol and the associated production of distillers dried grains also has not altered the long term rate of increase in soybean acres (+0.91 vs. +0.85 million). While likely not related to ethanol production, the decline in wheat acres may be slowing (-1.06 before 2004-07 vs. -0.73 million after). This potential slowing bears watching.
State Perspective on Corn Acres
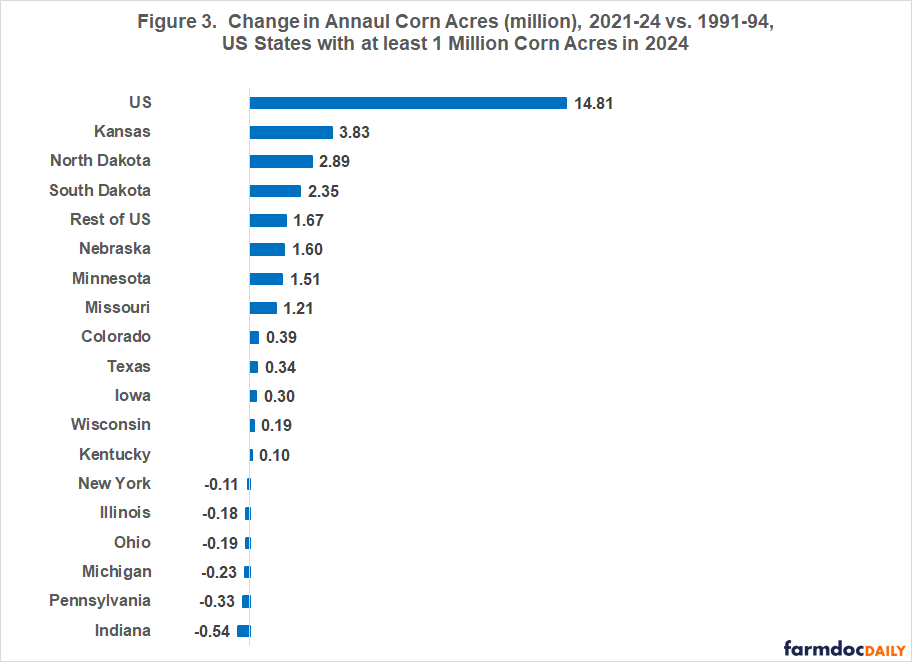
Annual US acres planted to corn have increased by 14.8 million since 1990 (see Figure 3). Kansas had the largest increase, 3.8 million acres. The top five states (Kansas, North and South Dakota, Nebraska, Minnesota) accounted for 82% of the US increase. All of the individual states listed in Figure 1 that had fewer acres of corn in 2021-24 than in 1991-94 are east of the Mississippi River. The individual states listed in Figure 3 accounted for 92% of US corn acres in 2024, other states are summed in “Rest of US.”
State Perspective on Soybean Acres
Since 1990, the US has added 78% more acres of soybeans than corn (+26.3 vs. +14.8 million). Kansas was the only individual state listed in both Figures 3 and 4 that added more corn than soybean acres (+3.8 vs. +2.7 million). Among the individual states listed in Figure 4, the southern states had the smallest increases in soybean acres. Moreover, Arkansas and Louisiana were the only listed states with fewer soybean acres in 2021-24 than 1991-94. The individual states listed in Figure 4 accounted for 96% of US soybean acres in 2024.
The top five individual states are the same for soybeans as for corn, but accounted for only 62% of the increase in US soybean acres compared with 82% of the increase in US corn acres. Correlation is +0.62 between the changes in corn and soybean acres from 1991-95 to 2021-24 for the individual states listed in both Figures 3 and 4. The correlation is significant with 99% statistical confidence.
There was almost no change in soybean acres in the group of states that had less than one million acres of soybeans in 2024 (see Figure 4). In contrast, the group of states with less than one million acres of corn in 2024 has accounted for 11% of the increase in US corn acres since 1990 (see Figure 3).

State Perspective on Wheat Acres
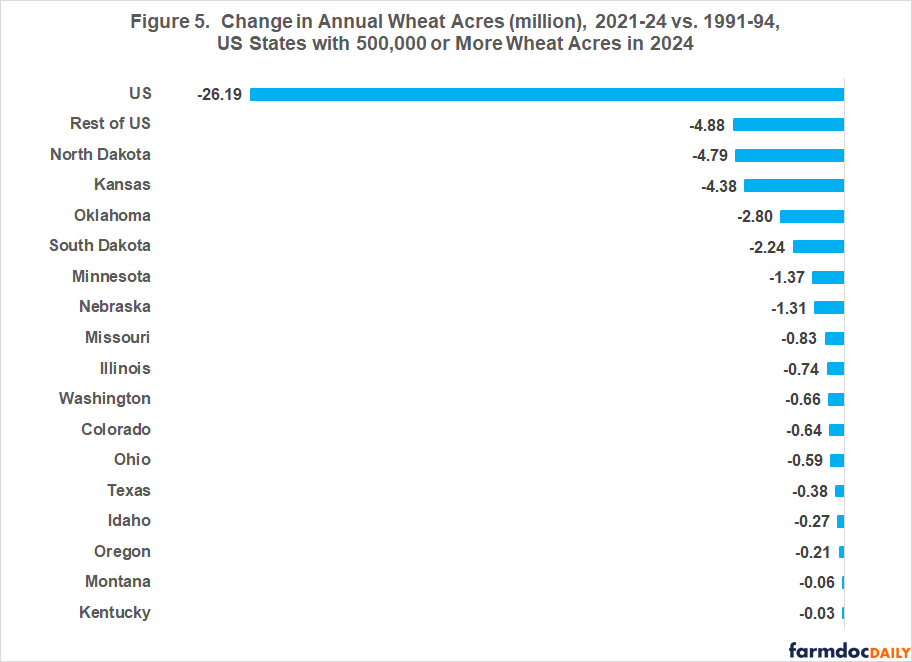
Every individual state listed in Figure 5 had fewer acres of wheat in 2021-24 than in 1991-94. Annual acres planted to wheat declined by over four million for North Dakota, Kansas, and the group of states that each had less than 500,000 acre of wheat in 2024. The individual states listed in Figure 5 accounted for 91% of US wheat acres in 2024.
For the US, the decline in annual wheat acres is almost identical to the increase in annual soybean acres. However, at the individual state level, the decline in wheat acres is more associated with the increase in corn acres than with the increase in soybean acres. For the individual states listed for both corn and wheat, the correlation is -0.82. It is significant at 99% statistical confidence. For the individual states listed for both soybeans and wheat, the correlation is -0.41. It is not significant with 90% statistical confidence, the lowest conventionally-used test level for statistical confidence.
Discussion
It is hard to understate the importance of the US policy decision in the early 1990s to establish planting flexibility as a core principle of the US crop safety net. It has resulted in a notable increase in the flexibility and responsiveness of US field crop agriculture.
Over the nearly 35 years since the US embraced planting flexibility, annual acres planted to US corn and soybeans have increased by 14 and 26 million, respectively. Annual planted acres of US wheat have declined by the same amount that US soybean acres have increased. Thus, total acres planted to corn, soybeans, and wheat have increased by about 15 million since 1990. The source of these acres will be explored in a subsequent article.
US corn and soybean acres have both shifted west and north, but US corn acres have shifted more west than north while US soybean acres have shifted more north than west.
At the individual state level, the decline in wheat acres is more closely associated with the increase in corn acres than with the increase in soybean acres. This finding suggests that wheat acres were more likely to have been converted into corn than soybean acres.
This analysis also finds that the boom in ethanol production from 2005 to 2015 has not altered the long-term trend increase in US corn and soybean acres.
Small acreage states as a group played no role in expanding US soybean acres but had among the largest changes in corn and, especially, wheat acres.
The preceding point has importance for forecasting year-to-year changes in US acres. Not considering changes in corn and wheat acres in smaller acreage states will lead to estimation error. Their collective role should be kept in mind as the planting season for 2025 spring crops approaches.
Data Sources
US Department of Agriculture, Economic Research Service. December 1990. The 1990 Farm Act and the 1990 Budget Reconciliation Act. Miscellaneous Publication Number 1489.
US Department of Agriculture, Economic Research Service. September 1996. Provisions of the Federal Agriculture Improvement and Reform Act of 1996. Edited by F. J. Nelson and L. P. Schertz. Agriculture Information Bulletin No. 729.
US Department of Agriculture, National Agricultural Statistics Service. January 15, 2024. QuickStats. http://quickstats.nass.U.S.da.gov/
Disclaimer: We request all readers, electronic media and others follow our citation guidelines when re-posting articles from farmdoc daily. Guidelines are available here. The farmdoc daily website falls under University of Illinois copyright and intellectual property rights. For a detailed statement, please see the University of Illinois Copyright Information and Policies here.