


Fringe Acres and US Average Corn Yield
Tightening estimates of old-crop ending stocks have buoyed the corn market in recent weeks. However, the prospect of massive acres and record yields are a potential counterweight to higher prices. At the end of March, USDA estimated 2025 US corn plantings at 95.3 million acres. Some analysts expect an even higher corn acreage number to be revealed after planting in the USDA June Acreage report. The current USDA trendline yield estimate to be confirmed in USDA’s May WASDE report is 181.0 bushels per acre, which if realized would be nearly two bushels above the existing record level set last year. Are both large acres and high yields feasible for corn? A common counter-argument is that increasing acreage requires planting corn on low-yielding, so-called ‘fringe’ acres (See Braun, April 16, 2025; Scheve, April 21, 2025). This article describes what we know about the relationship between corn planted acreage and realized yields from historical data. I conduct a simple comparison of acreage and yields relative to baseline levels that account for long-run trends in the productivity and location of corn production; this comparison shows big corn acres do not imply below expected yields.
What Are Fringe Acres?
Planting 95.3 million acres to corn in the United States requires acres that would not be planted to corn in a typical year. One way to do this is to shift acres in all areas from other crops, principally soybeans, so that the composition of acres has the same yield potential as it would when the quantity of corn planted acres is ‘normal’. Another way to get more corn acres is to plant corn on ground that is expected to yield below the national average corn yield; these are often called marginal or fringe acres. More fringe acres imply lower national average yield.
To provide a rough approximation of the relationship between fringe acres and national average yield without the need to assess the specific location of all corn planted acres, I define baseline corn acreage and consider deviations in historical planted acres from the baseline. Positive deviations represent more fringe acres and negative deviations represent fewer. I then consider the historical correlation between fringe acres and yield. If the deviations from baseline acres truly capture fringe acres, then we should observe negative correlation between fringe acres and national average yield.
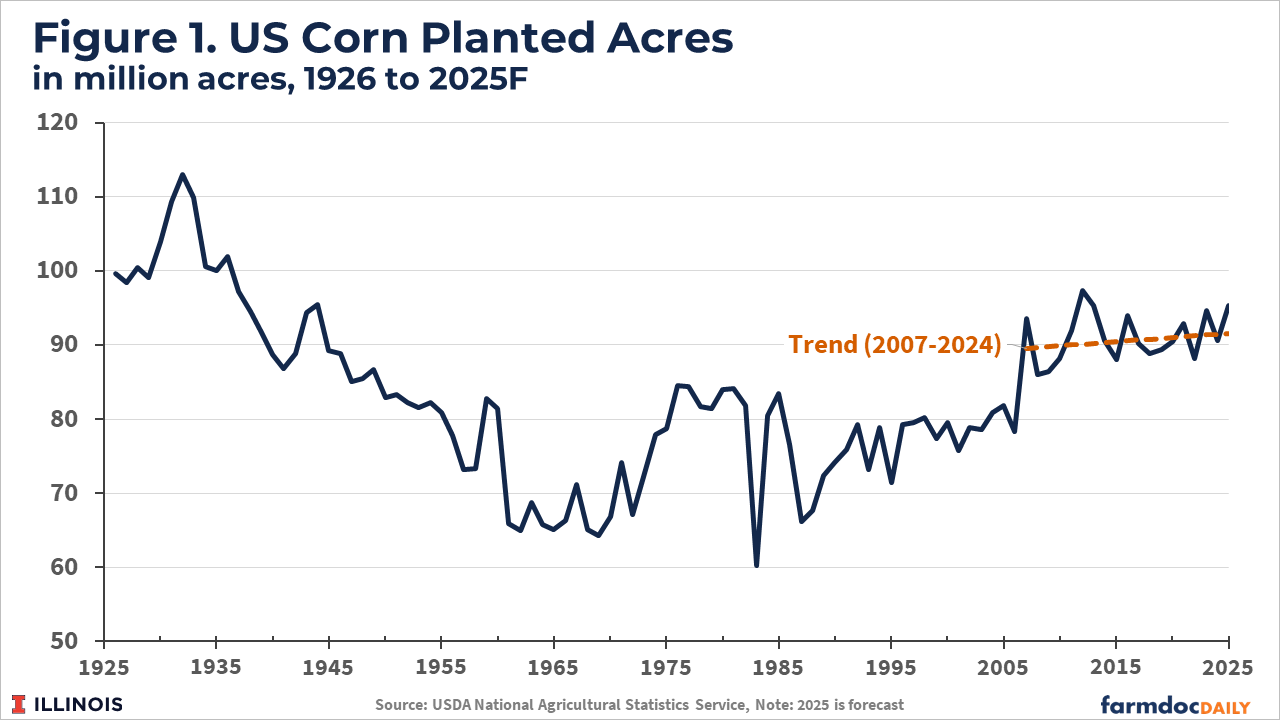
Figure 1 shows a long-run historical view of corn planted acreage in the US for the past one hundred years. Prior to the adoption of hybrid corn beginning in the 1930s, the US planted over 100 million acres of corn. Corn acres generally fell between 1930 and 1970, stabilized in the 1980s and 1990s, and jumped sharply in 2007 with the establishment of mandated ethanol use under the Renewable Fuels Standard. This long-run view suggests that the typical level of corn planted acres, and also the acres considered marginal, has changed over time. Only relatively recent acreage data are relevant to define what is a typical acreage level. Since 2007, corn acres have trended up slightly around an average level of about 91 million acres. The post-2007 trend shown in Figure 1 serves as a baseline. For 2025, trendline corn planted acres are 91.5 million, just slightly below the long-run USDA corn acreage baseline (See USDA-ERS, January 2025). The current 95.3 million acre estimate from USDA suggests about 3.8 million excess acres.
The Relationship Between Corn Planted Acres and National Yield
What happens when US farmers more plant corn than the baseline level, that is, there are more fringe acres? Figure 2 plots deviations in corn acreage from baseline against deviations in national average corn yield from a 25-year linear trend. (The 25-year linear trend in corn yield approximates the process used to generate the current USDA trend-based yield forecast of 181.0 bushels per acre.) The figure shows corn yield deviations typically range within 10 bushels per acre of trend, with the notable exception of the 2012 drought year. In 2012, corn acres were well above baseline and yields were nearly 40 bushels per acre below trend.
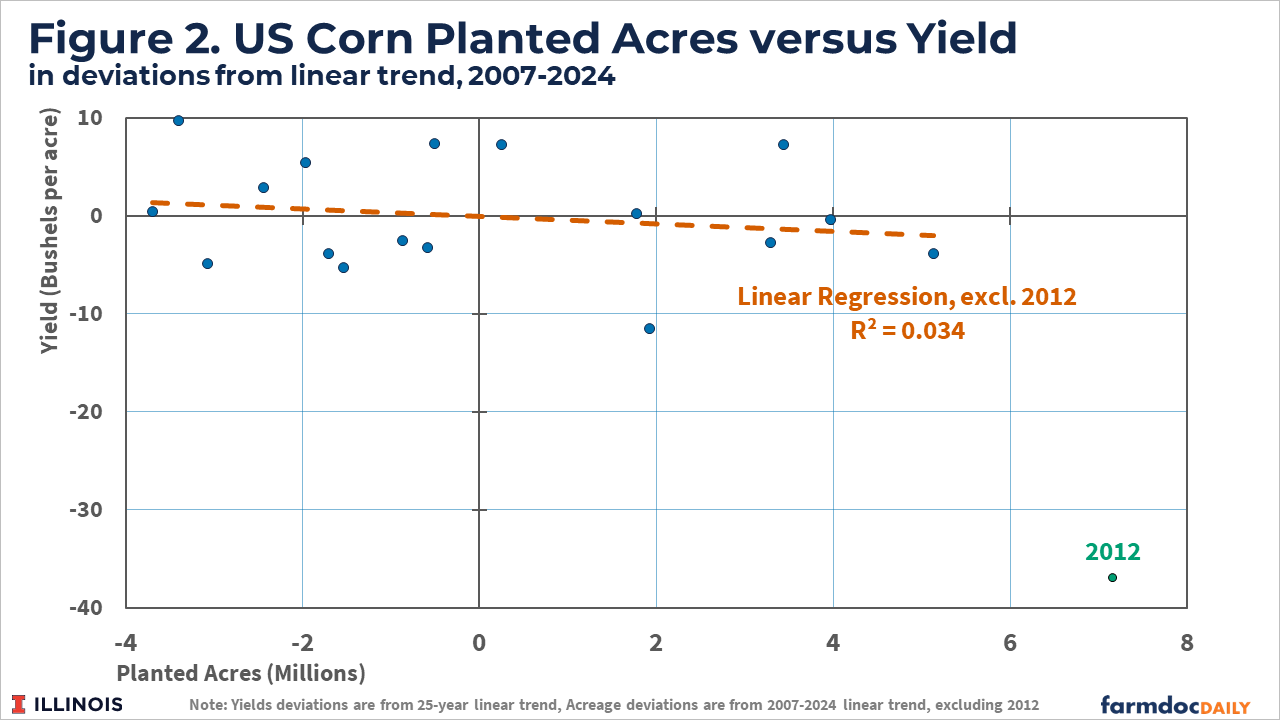
The regression line shown in Figure 2 summarizes the relationship between planted acre and yield deviations, excluding the outlier of 2012. This line indicates negligible correlation between corn acres and yield. Acreage deviations explain only about 3 percent of observed year-to-year variation in yield deviations from trend. Corn yields may be well above trend even when acreage above baseline suggests more fringe acres were brought into production. Years when planted acres were around the current 2025 estimate of 3.8 million above baseline, which plausibly include many fringe acres, have seen yield both above and below trend. In national data at least, the evidence for a consistent impact of fringe acres on yield is lacking.
Where Are Fringe Acres?
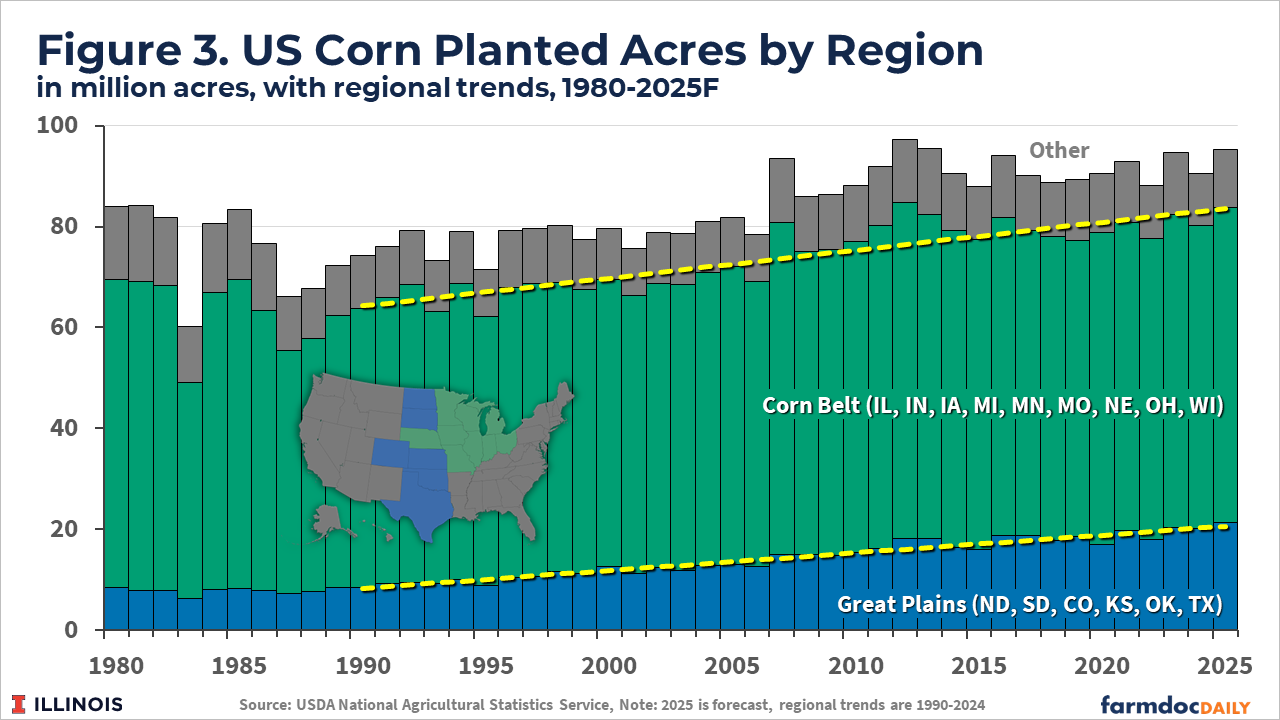
To further explore the possible impact of fringe acres on corn yield, I consider a location-based definition of fringe acres by characterizing regions based on average yield. When analysts describe the yield impact of fringe acres, they refer to corn production in states with significant acres but below national average yields. The main place where this occurs is in the Great Plains states from North Dakota south to Texas, including South Dakota, Colorado, Kansas, and Oklahoma. (Note that Nebraska is excluded from this regional definition because it has a high proportion of irrigated corn acres and above national average yield.) Whereas US national average corn yield was on average 164 bushels per acre in the period from 2007-2024, average corn yields in the Great Plains region were 125 to 143 bushels per acre, or about 20 to 40 bushels per acre lower.
Figure 3 shows that corn planted acreage on the Great Plains has increased at a roughly constant rate since about 1990. Prior to 1990, planted corn acreage in Great Plains states was approximately 8 million acres. Since 1990, Great Plains corn acreage has steadily grown by nearly 400,000 acres per year. Corn planted acres in traditional Corn Belt states, roughly those contiguous states east of the Great Plains and north of the Ohio River, has been essentially stable over the same period. The current USDA forecast for corn planted area in these states for 2025 is 21.3 million acres or about 700,000 acres above the linear trend shown in Figure 3. The combination of a long-run increase in Great Plains corn acreage and continued linear trendline growth in yield argues against a major production impact of fringe acres.
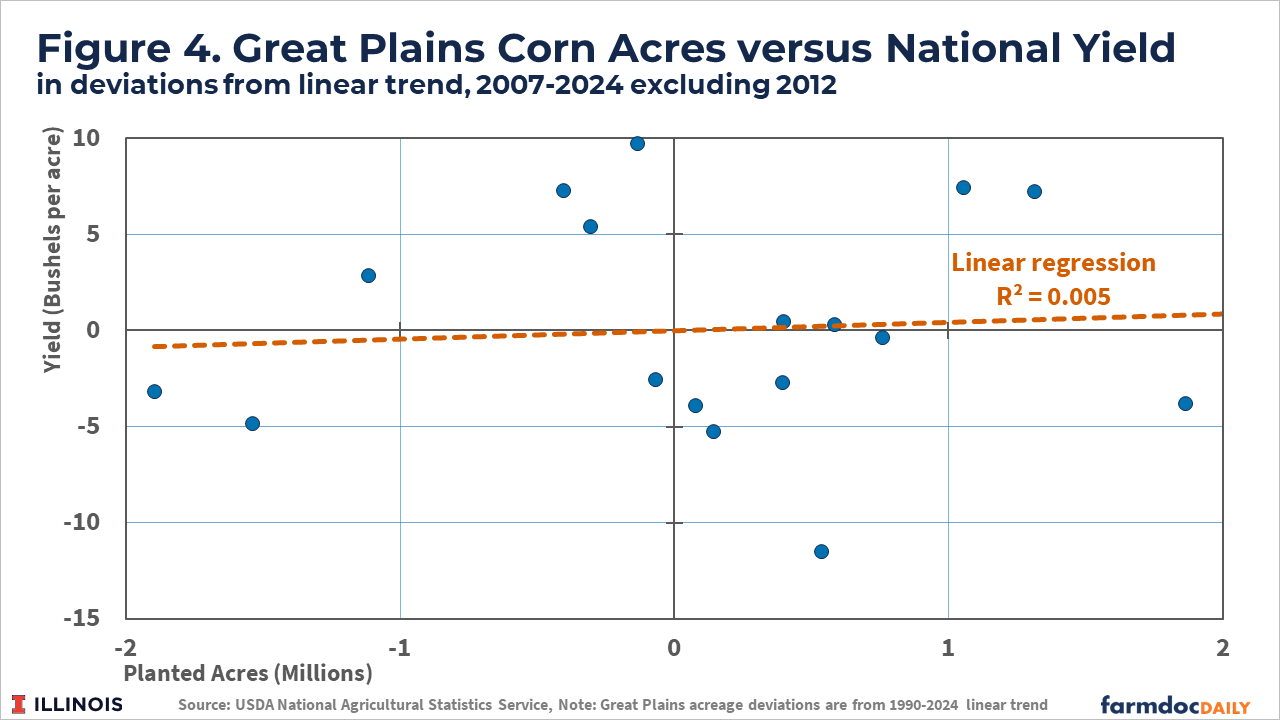
Because of the long-run linear trend in Great Plains corn acres, it is difficult to assess how many of the expected 21.3 million acres on the Great Plains are expected to be relatively low yielding. As an approximation, I consider the degree to which planted acres exceed the long-run linear trend as indicative of more marginal acres. Figure 4 replicates the analysis of Figure 2 for Great Plains corn acres relative to the post-1990 trend, again excluding the yield outlier of 2012. The estimated relationship between Great Plains acreage deviations and national yield deviations is essentially nil. Acreage deviations explain less than one percent of variation in national yields.
Concluding Thoughts
The non-relationship between planted acres and yield suggests a trendline yield estimate remains a suitable predictor of realized yield for the coming year, despite all indications of big corn planted acres. Information on the extent and location of planted acres is relatively uninformative about realized yields. Intuitively, this makes sense since unpredictable growing season weather is an obvious driver of observed yield shocks. Trendline yields plus large planted acres suggests a rapid return to US corn inventory projections above two billion bushels at the end of the upcoming 2025/26 marketing year. Absent a surge in demand for US corn that is at best uncertain in the current economic environment, corn availability at this level implies prices closer to long-term average levels. Current new-crop corn futures prices of about $4.50 per bushel are slightly higher than the long-run average.
References
Scheve, Jon. “Will the National Corn Yield Be A New Record This Year?” AG Web, April 21, 2025. https://www.agweb.com/opinion/will-corn-national-yield-be-new-record-year.
Braun, Karen. “Reality Check: Will Adding Fringe U.S. Corn Acres Drag Down Yield?” Reuters, April 15, 2025. https://www.reuters.com/markets/commodities/reality-check-will-adding-fringe-us-corn-acres-drag-down-yield-braun-2025-04-15/.
U.S. Department of Agriculture, Economic Research Service. “Agricultural Baseline.” Updated January 8, 2025, accessed April 28, 2025. https://www.ers.usda.gov/topics/farm-economy/agricultural-baseline.
Disclaimer: We request all readers, electronic media and others follow our citation guidelines when re-posting articles from farmdoc daily. Guidelines are available here. The farmdoc daily website falls under University of Illinois copyright and intellectual property rights. For a detailed statement, please see the University of Illinois Copyright Information and Policies here.