


Apiculture Rainfall Index Insurance: An Insurance Product for Beekeeping Operations of All Sizes
The Apiculture Rainfall Index Insurance program (API) is a crop insurance product underutilized by Illinois beekeepers. According to U.S. Department of Agriculture (USDA) estimates, fewer than 2% of Illinois colonies were enrolled in API in 2023. Like other Federal crop insurance programs, API is heavily subsidized. Since 2009, API has returned an average of $2.11 in payments for each $1.00 in U.S. beekeeper-paid premium. There is no minimum number of colonies required to buy an API policy, so even small Illinois and Midwest beekeepers should consider using API as a risk management tool.
API Use in Illinois and Nationwide
API was first piloted in a few states beginning in 2009 and expanded to include all 48 contiguous states in 2017. Figure 1 displays the number of colonies enrolled in API by state in 2025. A few states stand out as having relatively large enrollment. California has over 1.4 million colonies enrolled in API, by far the largest of any state. Florida and North Dakota are the next largest states in enrollment, with approximately 532,000 and 369,000 colonies enrolled in API, respectively. Commercial beekeeping operations in the U.S. often move their colonies throughout the year in search of flowering plants for bee nutrition and honey production. Each of these states plays an important role in this migratory system, hosting large numbers of honey bee colonies at different times during the year (see farmdoc daily article from February 17, 2025).
Figure 2 displays honey bee colony populations in Illinois each year, as well as Illinois API enrollment. There are two sources of data for Illinois colony populations: the USDA honey bee colonies report and the Illinois Department of Agriculture (IDOA). One will notice in Figure 2 that IDOA numbers are much larger than USDA estimates. The IDOA requires registration of all honey bee colonies in the state, even those operated by hobby beekeepers. USDA estimates colony populations based on surveys from beekeeping operations considered “farms.” The USDA defines a “farm” as any operation that produced and sold (or normally would have produced and sold) at least $1,000 of agricultural products in a year. Thus, many hobbyist beekeepers (particularly those with fewer than five colonies) in Illinois would not be categorized as a farm and counted as a beekeeping operation by USDA.
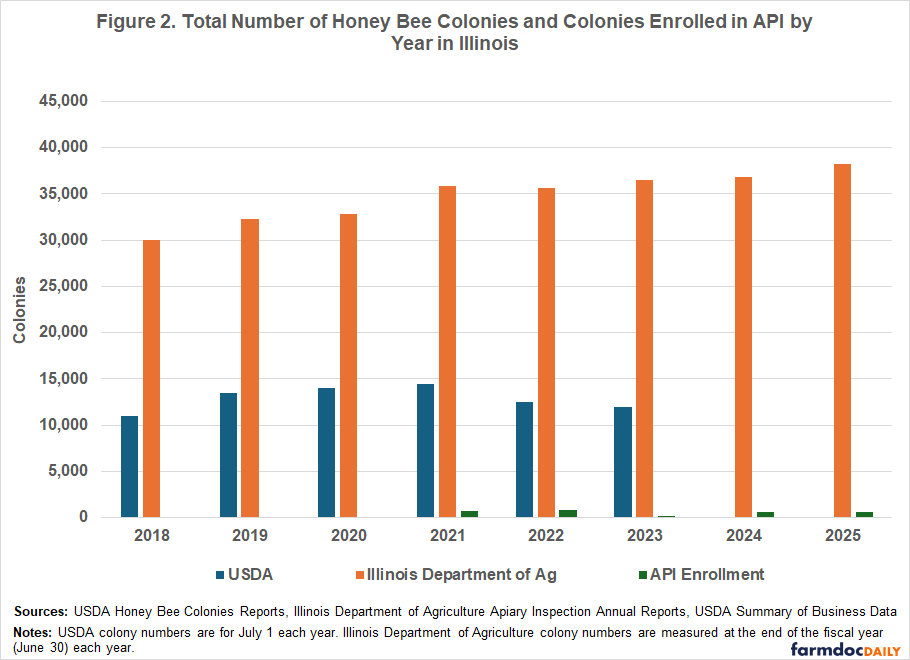
Figure 2 shows that the percentage of Illinois colonies enrolled in API each year is small regardless of whether USDA or IDOA colony numbers are used. In fact, API enrollment can barely be seen in Figure 2 because of low enrollment. In 2018, the first year API was available in Illinois, 90 colonies were enrolled (less than 1% of the 11,000 colonies according to USDA). The number of colonies enrolled increased over the next few years, reaching the highest number at 872 colonies enrolled in 2022 (7% of 12,500 colonies according to USDA). Enrollment has since dropped slightly, and Illinois had 660 colonies enrolled in API in 2025.
How API Works
API is meant to insure beekeepers against lower-than-average rainfall which could negatively impact revenues from honey production and other hive products (pollen, wax, breeding stock, pollination services, etc.). Below-average rainfall can also raise input costs for beekeepers. When there is less nectar and pollen available for honey bee colonies, beekeepers may need to feed their bees more sugar syrup and protein supplements. Poorer nutrition can weaken the colonies (Alaux and others, 2010), increasing the need for extra pest and disease treatments.
API is index insurance, meaning policies are not based on actual honey yields or other metrics reported by beekeepers to the USDA. Payments and coverage are based on a grid system, where grids cover an area of 0.25 degrees latitude by 0.25 degrees longitude (roughly 17 miles x 13 miles in Illinois). A policy is based on the specific grid in which the apiary is located. Rainfall index values are calculated by a weighted average of nearby National Oceanic and Atmospheric Administration (NOAA) weather stations and are reported in relation to historical average rainfall in that grid. API indemnities are paid out to the beekeeper when actual rainfall for their grid is sufficiently below its historical average.
To participate in API, beekeepers make multiple decisions:
Insured Colonies: Beekeepers must choose the number of colonies that will be insured. Not all of a beekeeper’s colonies need to be insured. There is also no minimum number of colonies necessary, so small beekeeping operations may participate. Knowing that most commercial beekeepers are migratory, it is important to note that a beekeeper cannot insure the same colonies across multiple grids.
Coverage Level: The coverage level is the rainfall index level at which an indemnity payment is triggered. Possible coverage levels are 70, 75, 80, 85, or 90 percent. Higher coverage levels have higher premium costs. There are different premium subsidy levels (the portion of the premium that the Federal Crop Insurance Corporation will pay). Subsidy levels range from 51 to 59 percent, with the lowest coverage level (70 percent) receiving the highest subsidy level (59 percent). Due to updates made in the One Big Beautiful Bill Act, beginning and veteran farmers and ranchers can receive additional premium subsidies ranging from 10 to 15 percent.
Productivity Factor: Beekeepers can adjust the covered value of their policy by adjusting the productivity factor to be between 60 to 150 percent. A base value of production is provided by the USDA Risk Management Agency (RMA) for each county using a five-year rolling average of state honey yields and the national average honey price. The productivity factor adjusts the coverage relative to that base value to best represent the value in their own operation. Together, the decisions on coverage level and productivity factor determine the dollar amount of protection. For example, if the county base value is $100 per hive, a coverage level of 90 percent and productivity factor of 125 percent would result in a dollar protection amount of $112.50 per hive.
Two-month Index Interval and Percentages of Value: The crux of the API insurance lies in the choices of coverage level and two-month intervals. Beekeepers must choose two-month intervals in which they want to insure against below-average rainfall. Two-month intervals run from January/February to November/December, and a participant cannot choose overlapping intervals, i.e., March/April and April/May.
The participant must place a percentage of value into each chosen interval, and the percentage of value across all intervals must sum to 100. To minimize risk, the percentage of value should reflect the ranking of the month intervals in which precipitation matters most for production of hive products. For example, if a participant chooses 90 percent coverage in May/June and July/August intervals, an indemnity is paid if the rainfall in either May/June or July/August falls below 90 percent of its historical average.
API Coverage Levels and Performance
Figure 3 displays the number of U.S. colonies enrolled in API by coverage level. The highest coverage level of 90% is by far the most popular with roughly 85% of the total colonies enrolled in 2025. Some beekeepers choose to enroll in the 85% coverage level, though this represents only about 15% of colonies enrolled in 2025. Very few colonies are enrolled in the coverage levels lower than 85%.
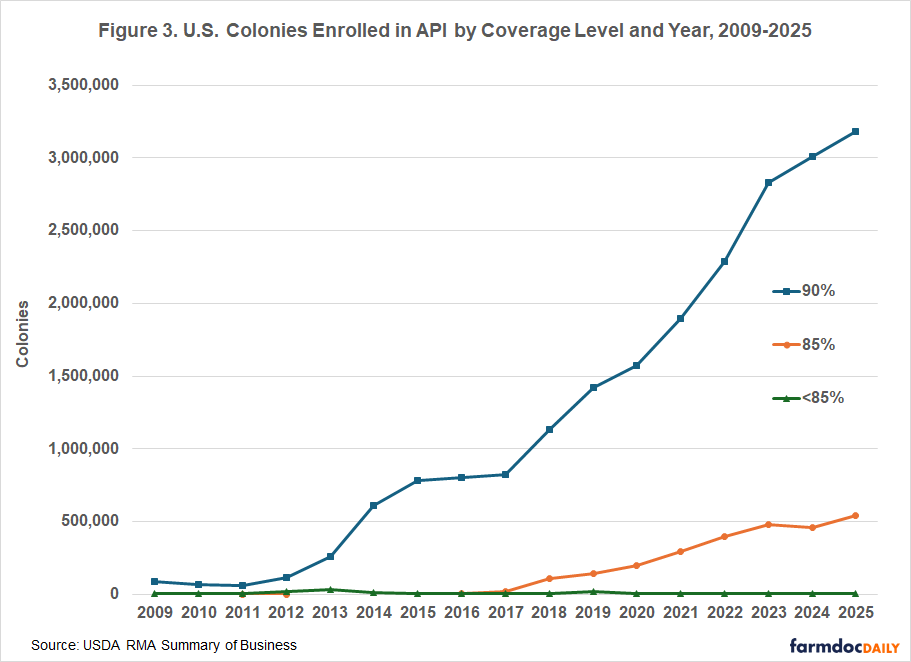
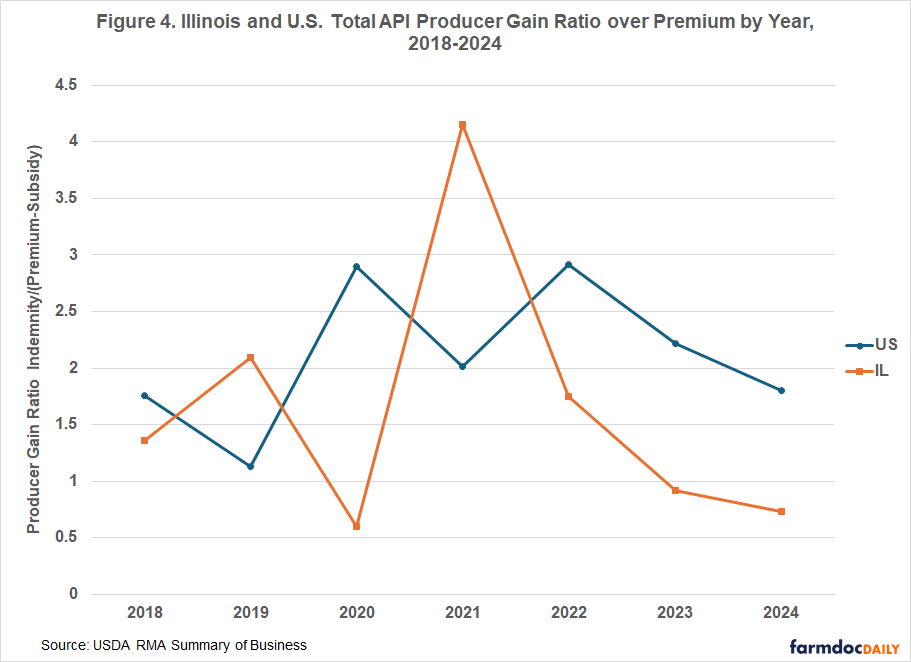
Figure 4 shows the producer gain ratio over premium for API from 2018 to 2024 for Illinois and the U.S. The producer gain ratio over premium is defined as the total indemnities collected by beekeepers divided by the total beekeeper-paid premium (total premium less total subsidy paid by the government). A producer gain ratio of one would mean that on average beekeepers received the same amount in indemnities as they paid out in premiums. Since 2018, Illinois beekeepers have received more in indemnities than they paid out in premiums: for every $1 spent on API premiums, on average Illinois beekeepers received $1.89 in indemnities. This was lower than the overall U.S. total, in which beekeepers received $2.11 in indemnities for every $1 paid in premiums. The producer gain ratio of course varies from year to year as seen in Figure 4. While Illinois beekeepers on average received less per dollar spent on API than the U.S. as a whole, it is worth noting in fewer than half of the years, Illinois beekeepers paid more in premiums than they received in indemnities (gain ratio less than one).
Summary and Further Information
API is a subsidized insurance product that has potential advantages for beekeeping operations. It offers a chosen level of protection against lower-than-average precipitation. Because the premiums are subsidized, the cost of this insurance coverage is reduced.
API is not a sufficient risk management strategy on its own. It should be utilized along with other risk management practices, such as diversifying apiary locations, ensuring good nutrition, and monitoring for pests and disease.
Most beekeepers in Illinois are hobbyists, with about 75% keeping five or fewer colonies according to the 2025 IDOA Apiary Inspection Annual Report. Because of this, many Illinois beekeepers may think the API program does not apply to them. However, API does not require a minimum number of colonies to buy a policy, so it works for small beekeepers as well as larger ones. In fact, the average API policy size in Illinois has ranged from 18 colonies per policy in 2018 up to 87 in 2022, showing that relatively small Illinois beekeepers have already used this insurance in the past.
API insurance can be purchased through any authorized crop insurance agent. The enrollment deadline for each year is December 1 of the prior year. The premium payment deadline is September 1 of the following year, so premiums do not need to be paid up front.
The USDA Risk Management Agency provides more information as well as an interactive decision tool that can be used to search for grids, explore policy options and costs, and plot out historical rainfall indices and policy outcomes.
References
Alaux, C., Ducloz, F., Crauser, D., & Le Conte, Y. (2010). Diet effects on honeybee immunocompetence. Biology letters, 6(4), 562-565. https://doi.org/10.1098/rsbl.2009.0986
Goodrich, B. and A. Altschuler. "Where Have All the Honey Bees Gone? To California Almond Orchards." farmdoc daily (15):30, Department of Agricultural and Consumer Economics, University of Illinois at Urbana-Champaign, February 17, 2025.
USDA RMA. Agent Locator. https://public-rma.fpac.usda.gov/apps/AgentLocator/#!/#%2F
USDA RMA. Apiculture Decision Support Tool. http://maps.agforceusa.com/api/ri/
USDA RMA. Rainfall Index. https://www.rma.usda.gov/policy-procedure/general-policies/rainfall-index
Disclaimer: We request all readers, electronic media and others follow our citation guidelines when re-posting articles from farmdoc daily. Guidelines are available here. The farmdoc daily website falls under University of Illinois copyright and intellectual property rights. For a detailed statement, please see the University of Illinois Copyright Information and Policies here.