


Projected Crop Reporting District Yields Compared to Historical Yields Given Drought
The National Agricultural Statistical Service (NASS) released projected 2011 corn yields by Crop Reporting District (CRD) on August 12th. In this post, the 2011 projected yields are compared to trend-adjusted historical yields for 1972 through 2010. Comparisons are made for six states for which NASS releases CRD estimates: Illinois, Indiana, Iowa, Missouri, Texas and Oklahoma. Northern Iowa, central Iowa, northern Illinois, western Illinois, and southwest Illinois have 2011 projected yields in the top half of historic trend-adjusted yields (see Figure 1). The remaining areas have below average yields. Kansas and Texas have extremely low yields, with some of Kansas and Texas CRD yields being the worst in the 1972 through 2010 period.
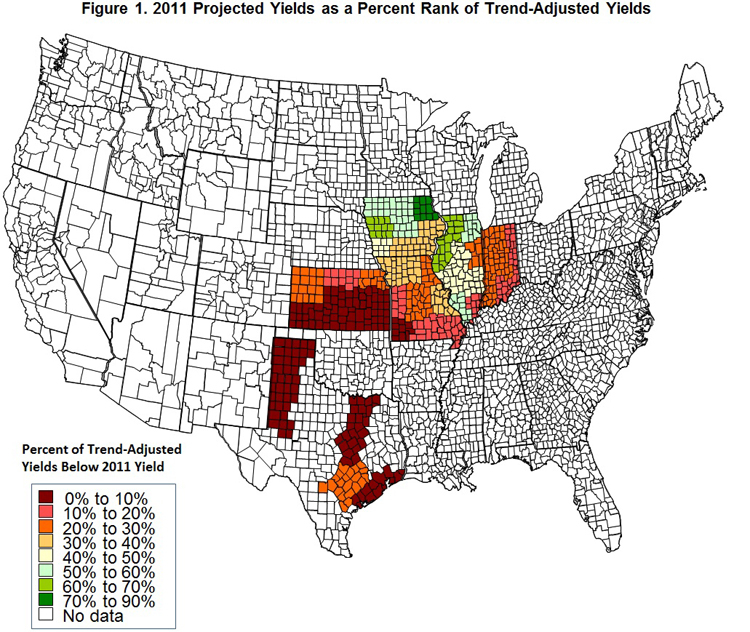
Yields in Figure 1 are colored based on percent of historic yields below the 2011 projected yield. For example, the central CRD yield in Illinois is 44 percent. This means that 44 percent of the trend-adjusted yields from 1972 through 2010 are below the projected 2011 yield of 179 bushels. A lower number indicates a worse yield. Trend-adjustments are made by first calculating a linear trend increase for each CRD. Then each year’s historic yield is adjusted to today’s conditions by adding a trend adjustment. The trend adjustment increases the further the year is back in history. The trend increase for the central Illinois CRD is 2.0 bushel per year. The 2010 trend-adjusted yield is 164 bushels, which equals the 162 bushel actual yield plus the 2 bushel trend adjustment. The 2009 trend-adjusted yield is 187 bushels, which equals the 183 bushel actual yield in 2009 plus a 4 bushel trend adjustment. The 2009 trend-adjustment of 4 bushels equals the 2 bushel trend increase times 2 years from 2011.
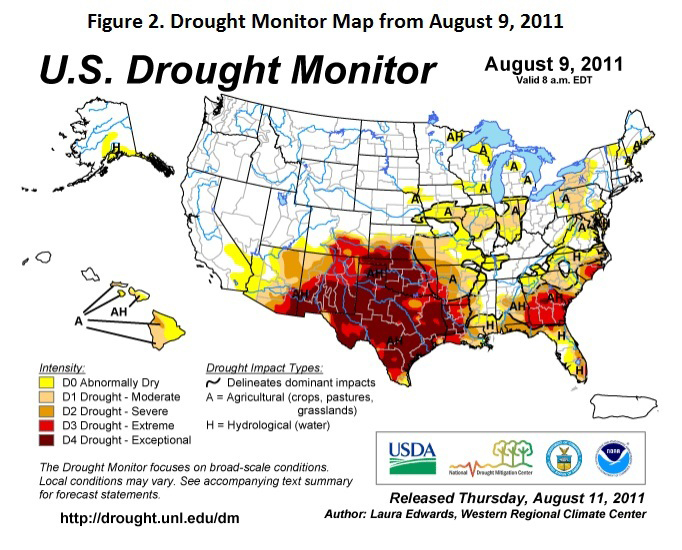
The poor yields for Texas and Kansas are not surprising. The drought centered in Texas is causing dramatic reduction in yields in drought stricken areas.
Some CRDs in Iowa and Illinois have relatively good yields. CRDs in northern Iowa have projected yields that are in the top half of historic trend-adjusted yields. The highest relative yield occurs in the northeast CRD of Iowa with 78 percent of historic yields below the 188 projected 2012 yield. Four CRDs in Illinois have more than 50 percent of the historic yields below the 2011 projected yield. Three of these districts are located in northern Illinois: northwest, northeast, and west CRDs. The southwest Illinois CRD also has a yield in the top 50 percent.
July weather was hot and dry, resulting in a growing area designated as drought. Within the corn-belt, much of Missouri, southeast Iowa, central Illinois, much of Indiana, and northwest Ohio was given a drought designation in the August 6th report (see Figure 2). Given drought conditions, projected CRD yields are remarkably high. For example, the central Illinois CRD in Illinois is designated as drought stricken. During July, the Bloomington airport in the middle of the central CRD had 1.4 inches of rain, well below the 4.0 inch average. The central CRD is projected to have a 179 bushel yields in 2012, with 43 percent of historic yields below the 2012 projected yields.
If yields turn out as predicted by NASS, it will be a tribute to genetic and farming improvements. However, drought conditions may point to lower estimates of CRD yields in future reports.
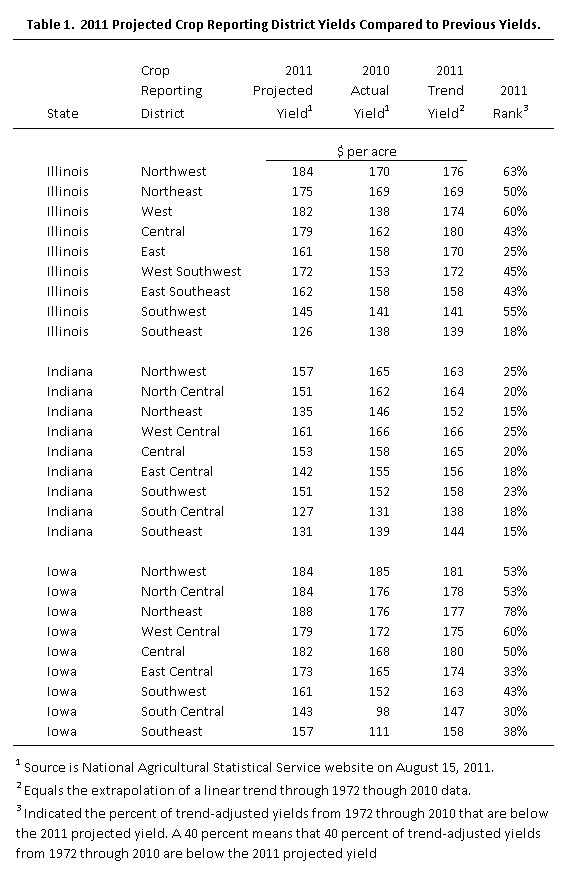
Table 1 gives tabular data for Illinois, Indiana, and Iowa CRD.
Disclaimer: We request all readers, electronic media and others follow our citation guidelines when re-posting articles from farmdoc daily. Guidelines are available here. The farmdoc daily website falls under University of Illinois copyright and intellectual property rights. For a detailed statement, please see the University of Illinois Copyright Information and Policies here.