


Sensitivity of Farm Balance Sheets to Changes in Farm Real Estate
A commonly cited financial health measure for U.S. households is the percent of housing equity to total household wealth. Household equity as a percentage of household net worth has declined to about 11% from 23% during the peak (Figure 1). A June 2011 report from CoreLogic estimates that Nevada has the highest negative equity percentage with 63% of all home mortgaged properties underwater, followed by Arizona (50%), Florida (46%), Michigan (36%) and California (31%). They estimate that approximately 22% of mortgages in Illinois have debt values exceeding property values.

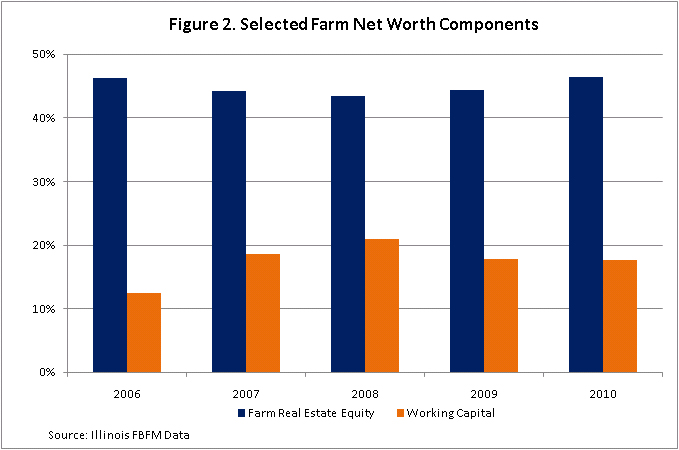
A similar measure can be calculated for farm enterprises. The farm real estate equity component of farm net worth has remained relatively constant at 44 to 46% for Illinois farms (Figure 2). Illinois farmland prices in Illinois increased approximately 30% over this period. A relatively constant ratio signals that farms strengthened liquidity as well as machinery and equipment equity at the same time that farmland increased.
A unique characteristic of commercial agriculture is the capital-intensive nature of the industry. USDA estimates that farm real estate composes approximately 84% of all assets employed in commercial agriculture. A typical operator in Illinois has approximately 45-55% of their assets invested in farm real estate.
The significance of farm real estate and the rapidly increasing farmland prices raise concerns about a farmland bubble similar to the recent housing crisis or a repeat of the farm financial crisis in the 1980s. In a recent speech, Federal Deposit Insurance Corporation (FDIC) chairperson Sheila Bair suggested that signs of instability exist in farmland markets and will require close monitoring.
One measure of vulnerability to changes in land values is to simulate impacts on leverage by shocking market values of farm real estate. Figure 3 shows the change in the debt-to-asset ratio on Illinois farms if land values dropped to 2006 levels, a 30% decline from 2010. The debt-to-asset ratio on the average Illinois farm increased modestly from 0.24 to 0.27 while leverage measures for young farmers (less than 30 years of age) increased from 0.30 to 0.45.
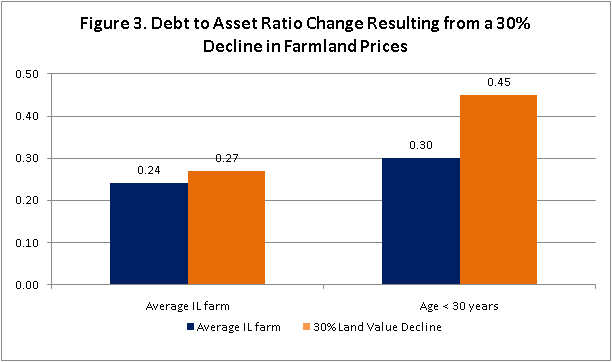
On average, agricultural producers’ balance sheets remain healthy after a potential shock in land values. However, these results vary widely among producers. Farm operations that financed recent farmland purchases and maintain higher leverage levels could be more vulnerable to potential land value declines.
Disclaimer: We request all readers, electronic media and others follow our citation guidelines when re-posting articles from farmdoc daily. Guidelines are available here. The farmdoc daily website falls under University of Illinois copyright and intellectual property rights. For a detailed statement, please see the University of Illinois Copyright Information and Policies here.