U.S. Corn Exports–The Rest of the Story
Exports of unprocessed (whole) corn from the U.S. vary substantially from year to year, ranging from 1.588 billion bushels to 2.437 billion bushels over the past 10 years, but generally have been trending lower since 2007-08. Annual exports from all other origins are also variable, but have been increasing since 2008-09 (Figure 1). For the 2011-12 marketing year, the USDA projects U.S. corn exports at a 9-year low of 1.65 billion bushels and exports from all other origins at a record large 2.02 billion bushels. If the forecasts are correct, this will be the first year since the early 1970s that U.S. exports were smaller than those from all other origins.
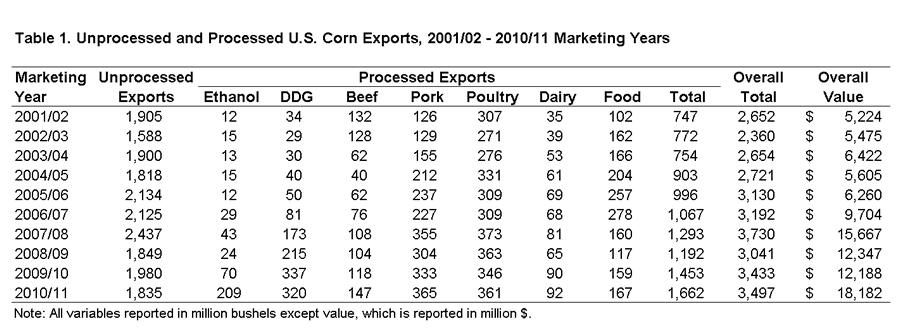
The exports of unprocessed corn, however, do not reflect the entire corn export picture for the U.S. since corn is also exported indirectly in various processed products. Exports of these products have increased substantially over the past 10 years. These products include ethanol, distillers dried grains (DDGs), meat, dairy products, and various food products. Here, we estimate the annual quantity of corn exported in processed form in these products over the past 10 years (Table 1).

The quantity of corn exported in the form of ethanol is estimated based on (1) the USDA estimate of the quantity of corn processed for ethanol and co-product production, (2) the assumption that just over two-thirds of a bushel of corn processed is consumed for ethanol production, and (3) the percentage of total ethanol production that is exported. The quantity of corn exported in the form of DDGs is estimated based on the quantity of DDGs exported and the assumption that approximately 17.75 pounds of DDGs are produced for each bushel of corn processed for ethanol production. That is, slightly less than one-third bushel of corn processed for ethanol remains as distillers grain.

Estimating corn exported in the form of meat and dairy products is not as straight-forward. The USDA provides estimates of exports of beef, pork, poultry, and dairy products so that exports as a percentage of production can be calculated for each species. The challenge is to estimate the quantity of corn and DDGs that are fed to each species. One approach would be to identify a typical feed ration for each species and calculate the total quantity of corn and DDGs fed to each. The difficulty is that typical rations are not easy to identify and rations have changed over time. Instead, we take advantage of the USDA’s estimate of Grain Consuming Animal Units (GCAUs) by species. Corn feeding for each species is estimated using the USDA’s estimate of total corn fed during the year and the percentage of total GCAUs represented by that species. The estimate of corn exported through that species is based on the percentage of production that is exported. The same process is used for the corn-equivalent of DDG feeding, except that the total of DDG feeding has to be estimated first. That total is calculated as estimated DDG production minus exports.
The quantity of corn exported as food products is estimated by the USDA and those estimates are used here. These food product exports include a variety of food ingredients, including starches, glucose, and fructose.
As shown in Table 1, while unprocessed (whole) corn exports have declined in recent years, corn exports in processed form have skyrocketed in several categories. Particularly notable are ethanol, DDG, and pork exports, which increased about 18, 10, and 3 times, respectively, over the last decade. In total, estimated exports of corn in processed form have increased from about 750 million bushels in the 2001-02 corn marketing year to 1.66 billion bushels during the 2010-11 marketing year. While exports of unprocessed corn have declined by 25 percent from the peak of 2007-08, estimated total corn exports have declined only 6 percent and represented 28 percent of U.S. corn production last year. Because the average corn price received by farmers has increased since 2006-07, the estimated farm value of total corn exports has increased sharply, from about $5.2 billion in 2001-02 to about $18.2 billion in 2010-11.
The rising importance of corn exports in processed versus unprocessed form is vividly illustrated in Figure 2. This chart also shows that despite the recent and spectacular increases in ethanol and DDG exports, livestock products as a group remain the largest processed form of corn exports. Figure 3 shows that corn exports in the form of pork, poultry, and DDGs represented about 30 percent of total exports, while exports of unprocessed corn in 2010-11 accounted for only 52 percent of the total.


The important take-away message is that the U.S. corn market remains highly export intensive, but the form is changing rapidly.
Disclaimer: We request all readers, electronic media and others follow our citation guidelines when re-posting articles from farmdoc daily. Guidelines are available here. The farmdoc daily website falls under University of Illinois copyright and intellectual property rights. For a detailed statement, please see the University of Illinois Copyright Information and Policies here.


