


The Historic Pattern of U.S Corn Yields, Any Implications for 2012?
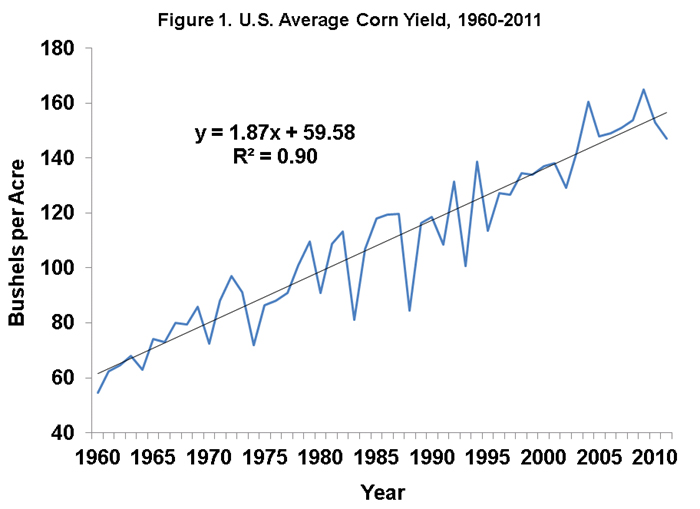
The U.S. average corn yield was below trend value in both 2010 and 2011. Market sentiment seems to be that such a pattern reduces the odds of a below-trend average yield in 2012. That sentiment raises the interesting issue of what, if anything can be learned from the historical pattern of U.S. average corn yields that would be useful in anticipating yields in any particular year? Here we examine the pattern of yields from 1960 through 2011 (Figure 1).
That pattern results in the following observations and thoughts:
- Yields have trended higher since 1960. We find that a linear trend is the best fit to actual average yields over that period and that yields have increased at a rate of 1.87 bushels per acre per year. Some have argued that the yield trend has increased in recent years as it did beginning in about 1960. We find a slight increase in the trend in some areas of the country in recent years, but cannot yet confirm an increase in the U.S. average trend yield. Our previous analysis of this topic is available here and here. The reason this is important in the present context is that if the rate of growth in trend yields has jumped in recent years then some recent yields that are shown as above trend in Figure 1 may actually be below trend.
- There has been substantial deviation from the trend yield in individual years (Figure 2). Over the 52 year period, the average yield was above the trend yield in 60 percent of the years and below the trend in 40 percent of the years. Since all deviations from a linear trend must sum to zero, this means that in the 40 percent of the years with a below trend yield the deviations were on average larger than the deviations in the more frequent years when yields were above trend. Specifically, the average deviation below trend was 8.6 bushels while the average deviation above trend was 5.8 bushels. The largest deviation below trend was 29.1 bushels (1988) while the largest deviation above trend was 16.9 bushels (2004). The frequency and magnitude of deviations are logical for two reasons: i) good (normal) growing season weather occurs more frequently than poor weather, and ii) good growing season weather helps corn yields less than poor weather hurts yields due to the non-linearity of the relationship between corn yields and precipitation. Further discussion of this topic can be found in our earlier report on crop weather modeling.

- The 60/40 split between above and below trend yields is a general statement that applies to any year in the sample. A different, but related, question is whether there is a marked correlation between deviations from year-to-year. In other words, is there a tendency towards continuation or reversal of deviations? Figure 3 shows that there is indeed a small negative correlation between the yield deviation in the previous year and the current year (correlations can vary between -1 and +1, with zero indicating no relationship). This means that a negative yield deviation last year tends to be followed by a positive deviation this year and vice versa. This tendency is sensitive to just a few years with large negative yield deviations. If 1983, 1988, and 1993 are deleted from the sample the negative correlation disappears.

- The correlation discussed above is based on comparing deviations in pairs of adjacent years. It is also interesting to examine whether longer “runs” in the deviations occur. The distribution of runs of consecutive positive or negative yield deviations is summarized in Table 1. There were 4 single year runs with positive deviations and 9 single year runs of negative deviations. This simply means that a positive deviation was followed by a negative deviation and vice versa in these 13 years. The longest run of negative deviations was 4 years (1974-1977), while positive deviations had runs of 4 years (1984-1987), 5 years (1965-1969), and 7 years (2003–2009). Since positive deviations are more common than negative deviations, it is logical that more and longer runs of positive yield deviations have occurred.
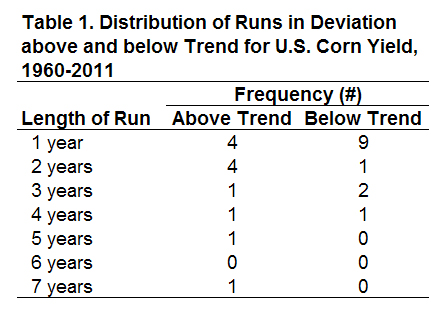
- Given that both 2010 and 2011 were negative deviations, of particular interest is the length of previous runs of negative deviations. It turns out there were only three other periods of two consecutive years of negative yield deviations (1960-1961, 1974-1975, and 1995-1996). In two instances, those two negative yield deviations were followed by a third year of negative deviation and in the third case two additional years of negative yield deviations occurred (1974-1977). So, even though multiple-year runs of negative yield deviations have not occurred frequently they have happened and we should expect them to happen again at some point in the future.
- There is an interesting connection between the runs of positive corn yield deviations and growing season weather. Specifically, the run of positive yield deviations from 1965 through 1969 led some to conclude that technological improvements had resulted in reduced risk of low corn yields and therefore had increased the trend. As it turned out, those yields instead reflected a period of generally favorable weather and not an increase in the underlying trend (see the final section of this publication for further discussion). The unprecedented run of positive yield deviations from 2003 through 2009 once again led some to conclude that the underlying corn trend yield had shifted higher. That period was also one of generally favorable weather, but as noted earlier, some have also argued that the trend has indeed shifted due to improved technology, particularly improved drought tolerance. The experience of the earlier episode of benign weather in the 1960s at least suggests a good deal of caution before concluding that large negative trend yield deviations are a thing of the past.
Summary
For any particular year, including 2012, history suggests a 60 percent chance of an average U.S. corn yield above trend and a 40 percent chance of an average yield below trend value. Those arguing that 2012 yields cannot be below trend because both 2010 and 2011 were also below trend ignore the actual pattern of historical corn yields. The odds slightly favor a corn yield above trend in 2012 but there is certainly precedent for another year below trend. More specific expectations about the 2012 average yield will depend on how the planting and growing season unfolds.
Disclaimer: We request all readers, electronic media and others follow our citation guidelines when re-posting articles from farmdoc daily. Guidelines are available here. The farmdoc daily website falls under University of Illinois copyright and intellectual property rights. For a detailed statement, please see the University of Illinois Copyright Information and Policies here.