


Rationing the 2012 Corn Crop Revisited
A month ago, we presented alternative supply, consumption, and price projections for the 2012-13 marketing year in the context of addressing the question of whether or not prices were high enough to ration a much smaller crop. We concluded at that time that prices were likely still not high enough if the national average yield was below 135 bushels (see post here). Now that corn prices have moved higher and the USDA has released the first survey-based forecast of 2012 corn yield and production, we revisit the question of rationing.
Since the size of the 2012 crop is still not known, we present three alternative production, consumption, and price scenarios that differ from the USDA’s projections released on August 10. These alternatives, along with the current USDA projections for the 2011-12 and 2012-13 marketing years, are presented in Table 1. On the production side, all three alternative scenarios use a slightly smaller forecast of harvested acreage than reflected in the USDA’s August survey and slightly lower than used in the analysis of a month ago. The smaller forecast reflects the expectation that both acreage harvested for silage and abandoned acres will exceed producers’ expectations when surveyed for the August report. The expected difference between planted acreage and acreage harvested for grain of 9.4 million acres is more consistent with the experience of the previous dry years of 1988 and 2002.
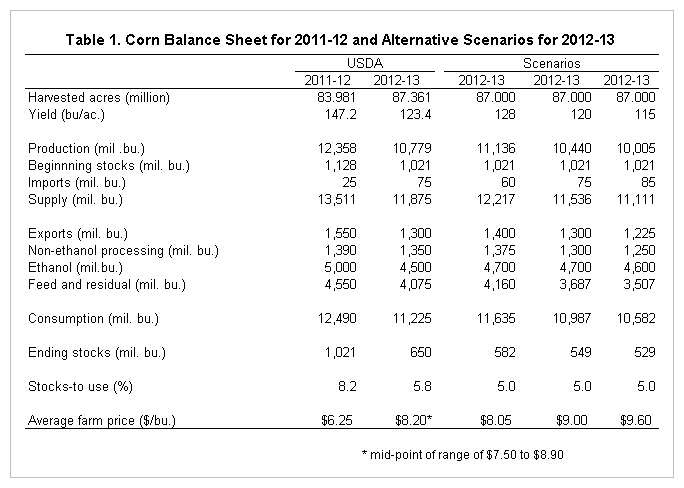
Three alternative yield scenarios are presented. One scenario reflects a yield of 128 bushels, which is 4.6 bushels above the USDA August forecast. This scenario is generally consistent with the experience of 1988 and 2002 when the final yield estimates were above the August forecast by 6.1 and 4.1 bushels, respectively. The other two scenarios reflect average yields of 120 and 115 bushels. Those yields are generally consistent with the experiences of 1995, 2010, and 2011 when final yield estimates were 12.1, 12.2 and 5.8 bushels below the August forecast. An alternative to reflect the 1983 experience of an 18.3 bushels decline from the August forecast to the final estimate is not included.
The projections of total consumption for each scenario reflect the limited supply of corn and the assumption that ending stocks will be reduced to a minimum pipeline level equal to 5 percent of consumption. Compared to projected consumption for the current marketing year that ends on August 31, the USDA’s projections for 2012-13 reflect a decline in total consumption of 1.265 billion bushels. The three alternative scenarios reflect declines of 855 million, 1.503 billion, and 1.908 billion bushels, respectively. Our projections of consumption by sector differ substantially from those of a month ago due to smaller production scenarios and a different view of the ethanol demand for corn.
Ethanol has become the dominant source of octane enhancement in the motor fuel supply and few alternatives are available in the short run in adequate quantity or at competitive prices to replace ethanol. As a result, the consumption of ethanol is expected to remain very large under all three production scenarios. See our recent analysis of ethanol demand here. Ethanol demand will be motivated by the need for octane rather than the RFS mandate, but will be limited by the blend wall plus net exports. Here we calculate that the blend wall for the 2012-13 marketing year is 13.3 billion gallons of ethanol and assume that net trade of ethanol is zero. Assuming a yield of 2.8 gallons of ethanol per bushel of corn, 4.75 billion bushels would be required to produce 13.3 billion gallons of ethanol. Allowing for some continued drawdown in ethanol stocks, we use a projection of 4.7 billion bushels of corn for ethanol and by-product production for two of the alternative scenarios. The forecast is reduced to 4.6 billion bushels for the smallest supply scenario in recognition that high corn and ethanol prices might motivate the use of larger quantities of other octane enhancers.
The projection of corn exports and non-ethanol processing uses of corn under each scenario contain small deviations from the USDA projections, reflecting larger or smaller supplies and lower or higher prices. Feed and residual use of corn is then calculated as the difference between total consumption and consumption in the other sectors. Those projections underscore the magnitude of rationing that would be required in the domestic livestock sector under each production scenario. The feed and residual figures actually understate the magnitude of year-over-year reduction in “corn based” feeding that would be required since each scenario includes less corn used for ethanol production than used during the current marketing year and therefore a smaller supply of distillers’ grain. Assuming that each bushel of corn used for ethanol produces one-third bushel equivalent of distillers’ grain and that three quarters of the distillers’ grain is used domestically, a reduction from 5 billion to 4.7 billion bushels of corn for ethanol reduces the domestic availability of corn equivalents by about 75 million bushels. Ethanol use at 4.6 billion bushels would reduce the domestic availability of corn equivalents by about 100 million bushels. The USDA’s projection of 4.5 billion bushels for ethanol reflects a reduction of about 125 million bushels of corn equivalents. Compared to the projection of feed and residual use and implied domestic use of distillers’ grain during the current year, the USDA projections of corn equivalent consumption for 2012-13 represent a year-over-year decline of 10 percent. The three alternative scenarios represent declines of 8, 16, and 20 percent, respectively, in corn based feed and residual use.
The projected average farm price for each scenario uses the USDA price projection for the 2011-12 marketing year as a starting point and applies an estimate of the total price flexibility coefficient reported in a recent article by Mike Adjemian and Aaron Smith found here. We use their flexibility estimates for the current era of large ethanol use. Specifically, we use an estimate of -3, which, in order to be conservative, is approximately equal to the upper end of the 95% confidence limit (smallest in absolute value) of their flexibility estimates for the current time period. This estimate implies that for each 1 percent change in total supply the average price changes by 3 percent in the opposite direction.
Conclusion
In central Illinois, the current forward bid for harvest delivered corn is near $7.90, but has recently been above $8.00. The balance sheet alternatives presented here suggest that corn prices are now likely high enough to ration the 2012 corn crop if production is near or above the USDA’s current projection. Higher prices, and in some scenarios much higher prices, would be expected if production is less than the current projection in order to initiate more aggressive rationing in the livestock sector.
In closing, we underscore the critical assumption about ethanol demand made in this analysis. If alternatives to ethanol can be made available in sufficient quantities at competitive prices, a partial waiver of the RFS mandate, for example, might result in much lower consumption of corn for ethanol than assumed here and reduce the amount of rationing required in the domestic livestock industry.
Disclaimer: We request all readers, electronic media and others follow our citation guidelines when re-posting articles from farmdoc daily. Guidelines are available here. The farmdoc daily website falls under University of Illinois copyright and intellectual property rights. For a detailed statement, please see the University of Illinois Copyright Information and Policies here.