


Cash Rents and Crop Revenues in Illinois
‘Tis the season for negotiating land rental agreements for the 2013 crop year. Recent posts have discussed trends in rental agreements (here) and relative performance of share/flex and fixed cash rent agreements over the past few crop years (here). Today’s post looks at the historical relationship between average cash rent levels in Illinois and average crop revenues. These historical relationships provide some basis for expectations for cash rental rates in the coming crop years.
Figure 1 reports average corn and soybean revenues ($/acre) for the state of Illinois from 1976 through 2012. Revenue is defined as the product of the marketing year price and crop yield reported by the USDA, and is plotted on the left axis for both corn and soybeans. For 2012, the midpoint of the ranges for corn and soybean prices for the 12/13 year from the October WASDE report, and current yield estimates were used. Average cash rents for Illinois ($/acre) are plotted on the right axis. Note that the crop revenue and cash rent axes are defined so that cash rent levels on the right are equal to 40% of the crop revenue axis values on the left.
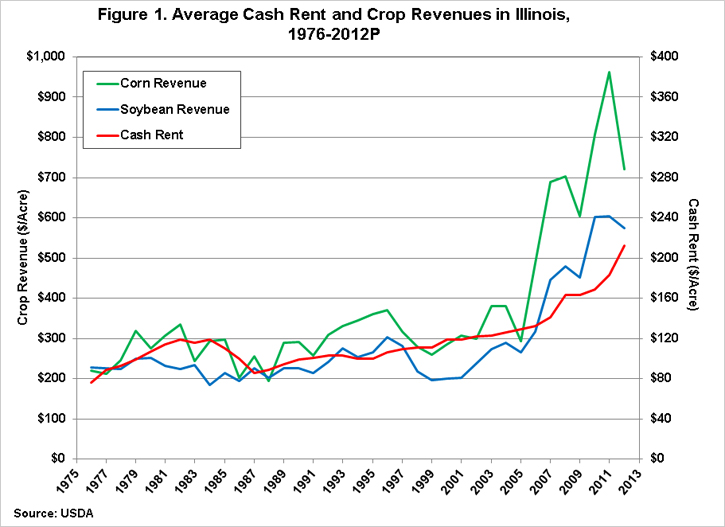
In general, cash rent levels have increased with crop revenue levels over time. With the exception of the period following the 1980s farm crisis, cash rents have tended to increase or remain stable each year even during periods of declining revenues. Examples of this include the 1996 to 1999 period, and the declines in both corn and soybean revenues in 2005 and 2009. From 1996 to 2009, corn and soybean revenues fell by 30% and 36%, respectively. Over this same time period, average cash rent levels increased modestly from $106/acre to $111/acre. In 2005, corn revenues fell by 23% while soybean revenues declined by 8%. The average cash rent in Illinois increased from $129 to $132. Revenues fell by 14% and 6% from 2008 to 2009 while cash rents remained stable.
Similarly, during periods of increasing crop revenues, average cash rent levels tend to adjust upward at a slower rate. From 1991 to 1996, corn and soybean revenues increased by more than 40% while the average cash rent in Illinois increased by only 5% from $101/acre to $106/acre. Since 2005, corn and soybean revenues have more than doubled (146% increase for corn, 116% increase for soybeans) while the average cash rent level in 2012 of $212/acre is a 64% increase from the $129/acre cash rent level reported for 2005.
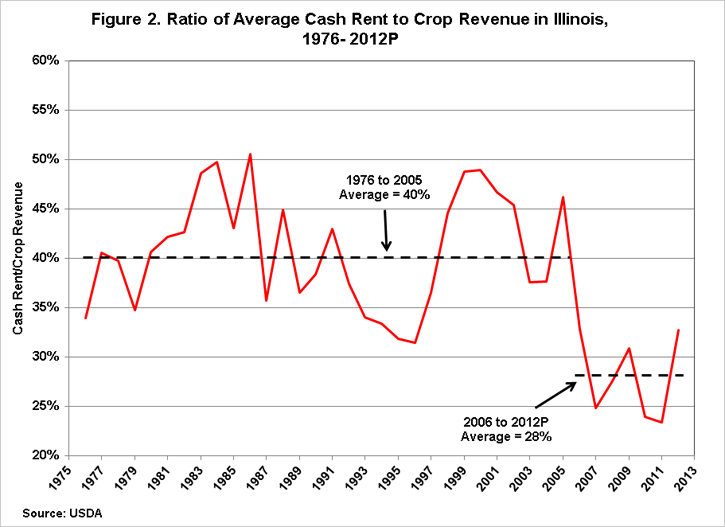
Figure 2 reports the ratio of the average cash rent level in Illinois to crop revenues from 1976 to 2012. Note that crop revenues for the data in figure 2 are defined based on a 50-50 crop rotation with corn and soybeans. From 1976 through 2005, the ratio of cash rent to crop revenues averaged 40% in Illinois. Of note are periods when this ratio rose close to 50% – during the 1980s farm crisis and again during the period of low revenues and farm financial stress from 1998 to 2002. The ratio fell below 35% during the period of increasing returns from 1991 to 1996. Since 2005, the average ratio of cash rent to crop revenues in Illinois has been much lower, averaging 28% over the 2006 to 2012 crop years.
Summary
The historical relationship between average cash rents and crop revenue levels in Illinois show that, while average cash rental rates adjust to changes in crop revenues, they do so at a slower rate. In periods of increasing revenues, cash rents will also increase but at a slower rate. Similarly, in periods of declining crop revenues cash rates tend to remain stable rather than immediately adjusting to lower levels. Historically, the ratio of average cash rents to crop revenues has averaged about 40%. With the large increase in revenue levels experienced over the past 7 years, that ratio has declined to an average of 28% since 2005. This suggests that we might continue to see an increase in cash rent levels despite the large yield losses and reductions in revenue for 2012. Furthermore, even if the longer-term outlook is for lower crop prices, cash rent levels could remain stable or even continue to increase as the ratio adjusts to the higher historical level.
However, the many changes experienced in the grain industry over the past decade may cause the historical relationships to be misleading for the future. As pointed out in a recent post (here) ,more and more cash rent agreements are being negotiated on an annual basis in response to increased price variability. This trend will likely reduce the lag effect seen in average cash rent levels.
Disclaimer: We request all readers, electronic media and others follow our citation guidelines when re-posting articles from farmdoc daily. Guidelines are available here. The farmdoc daily website falls under University of Illinois copyright and intellectual property rights. For a detailed statement, please see the University of Illinois Copyright Information and Policies here.