


The Increasing Waistline of the Deferred Tax Monster
Agricultural producers are allowed to use the cash method of accounting for calculating income for federal and state tax purposes. This causes inevitable and numerous differences between taxable farm income and accrual farm income. For the most part, farm financial statements are not prepared in a way that recognizes the impact these differences have on tax liability, earnings, and net worth. Recognizing the amount of the estimated deferred tax liability and its’ possible impact on your operation are part of the analysis of every year’s business.
Deferred taxes simply reconcile the tax basis of balance sheet assets with the market value of those same assets in a manner that answers the question: If all assets could be sold for the amount shown on the balance sheet, how much taxable income would result.
For our purposes here, we have used a group of farms from the Illinois FBFM database and made some assumption about tax rates. Self-employment tax is calculated on a portion of the current deferred tax liability as well as income tax. Favorable capital gains tax rates are used in the calculation of deferred taxes on long term assets. So, a realistic estimation of deferred taxes is calculated.
See Table 1 for a five-year history of the dollar value of the estimated deferred tax liability for a group of farms who are members of Illinois FBFM. From 2007 to 2011, the increase in estimated deferred taxes was $229,425. The increases year-over-year are not consistent, but keep in mind that the annual increase is just for a single year and the estimated deferred tax liability is increasing every year since none of the years had a zero or negative increase and the deferred tax liability is becoming increasingly larger over the five-year period. With the exception of 2009, the current part of the estimated deferred tax liability grew steadily. This is where your crop and market livestock inventories are reported and this coincides with a period of good yields and good prices. The intermediate portion of the estimated deferred tax liability also increases; the value of machinery would be a significant item in this section as would breeding livestock. This could be due to use of tax policy (the IRS Code Section 179 Expense Election and Bonus Depreciation) that keeps tax basis low while an active used machinery market kept used machinery values high. The increase in the long term portion of estimated deferred tax liabilities is largely due to the increase in land values.

If you look at the estimated deferred tax liabilities from a percentage point of view, one realizes that the source of the estimated deferred tax liability (current, intermediate, long term) is relatively consistent from year-to-year. The longer term picture tells that we’ve traded a bit of the current portion for the long term portion. See Table 2.

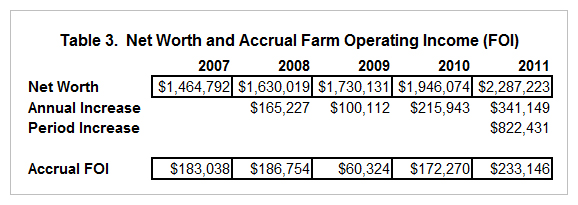
In production agriculture, we tend to analyze financial statements without much of an estimated deferred tax liability present on our balance sheets. By custom and tradition, we review and analyze the various ratios and benchmarks without recognizing the deferred tax liability. It bears noting that one’s net worth does have a deferred tax liability ‘claim’ on it, we just don’t always recognize it. Some would counter that deferred taxes are not real. That may be true, but events that could trigger some or all of a deferred tax liability need to be recognized since the impact could be significant. Again, from Table 1, of the $2,287,223 average net worth in 2011 there is a claim of $610,721 from deferred taxes – a very significant 26.7% of net worth! The five-year period in review reveals that as the waistline of deferred taxes has expanded – and we have simply been buying bigger pants!
The authors would like to acknowledge that data used in this study comes from the local Farm Business Farm Management (FBFM) Associations across the State of Illinois. Without their cooperation, information as comprehensive and accurate as this would not be available for educational purposes. FBFM, which consists of 5,700 plus farmers and 60 professional field staff, is a not-for-profit organization available to all farm operators in Illinois. FBFM staff provide counsel along with recordkeeping, farm financial management, business entity planning and income tax management. For more information, please contact the State FBFM Office located at the University of Illinois Department of Agricultural and Consumer Economics at 217.333.5511 or visit the FBFM website at www.fbfm.org.
Disclaimer: We request all readers, electronic media and others follow our citation guidelines when re-posting articles from farmdoc daily. Guidelines are available here. The farmdoc daily website falls under University of Illinois copyright and intellectual property rights. For a detailed statement, please see the University of Illinois Copyright Information and Policies here.