


Farmland Turnover in Illinois
There have been several very notable land sales in Illinois and surrounding states setting new high per acre sales prices in many areas, and leading to increased interest by others in evaluating both potential sales and purchasing opportunities. This year, there again seems to be a flurry of end-of-year farmland auctions and new listings of farm properties. Recently, at two separate meetings I have heard reports by professional appraisers that new requests are “flooding in” for farmland appraisals supporting end of year decisions about trust creation or sale. Casual explanations of the turnover activity include elevated concern about tax and estate law changes, efforts to take advantage of market momentum, strong balance sheets and derived demand from recent high income years, and continuing strong investor demand. Others have suggested that the level of activity in the farmland market is not that unusual and that there are often peaks in the 4th and 1st quarters each year — and that this year is thus not abnormal at all. And on the other side of the argument, farmers and investors seeking additional land to continue to cite thin market conditions; neighbor bidding wars are noted as explanations of high sales prices; numerous reports occur of auctions that fail to meet reserve requirements; and there remains low interest by absentee owners in selling in the majority of cases.
So how much farmland actually sells each year in Illinois?
It turns out that is a difficult question to answer directly. First, while property transfer records are public, the definition of a farm and a sale are both somewhat difficult to singularly identify. Farms are classified by both type and use, and for taxation purposes, may qualify as a farm but be essentially a development property, or not farmable for other reasons. Likewise, parcel size may limit the usefulness in a commercial scale farm operation of certain small “farm” parcels. In the end, the definition of a farm is that which interests the farm buyer. For concreteness, the data in the tabulations below limit those treated as a potential “farm” sale to those with 10 or greater acres (eliminating many rural residence and lifestyle farms) and less than 1281 acres (sales greater than two sections are quite rare and often not market based) to help eliminate a few outlier conditions. Likewise a sale to a relative or a related business party, while recorded as a transfer, is not likely to have been offered to the public at large and should perhaps not be treated in the same form as a sale where multiple buyers had equal access to the property. Other transfers are recorded, typically within trust or between related parties, where a sale price of $1 is used to validate the contract, but again is not a representative sale. Prior to 2000, our data allow a direct control for related party transfers, but from 2000 forward some (reasonable) assumptions must be made to control for this issue. For some controls of representativeness, the data are also screened to exclude sales with price per acre values below $100 or above $20,000 to limit the influence of non- representative sales and development parcel influence as well. Additionally, the land had to be classified as some form of farm in either the type or use fields of the transfer form to remain. Thus, a few non-farm agricultural parcels (e.g., recreational, mining areas, etc.) were also removed.
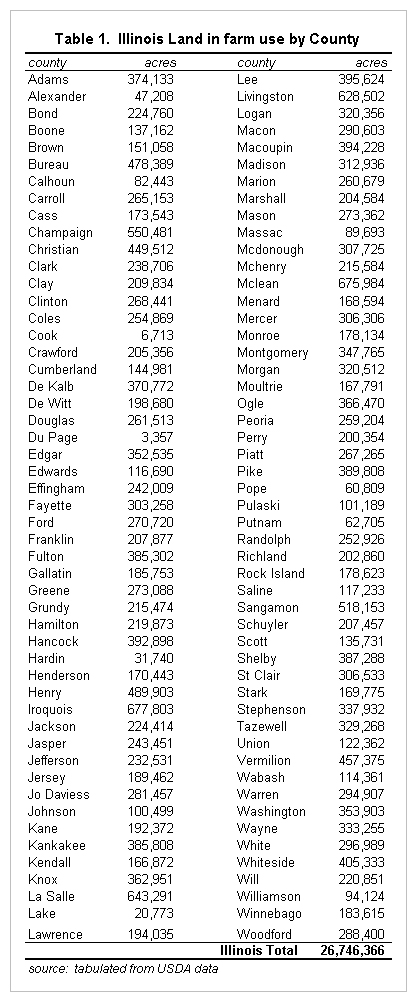
In Illinois, there are approximately 26.7 million acres of farmland, down slightly each year as irreversible developments occur, and distributed roughly in proportion to land mass except for areas around Chicago, and other metropolitan areas of the state. Table 1 shows land in farms by county by in farm use from the most recent Census of Agriculture in 2007. The totals will have declined slightly since then, but proportions remain relatively intact. Interestingly, Cook County is very large in land mass terms and still has over 6 thousand acres classified as farmland, though it is unlikely any “sales” would occur under conditions that would represent commercial farm conditions.
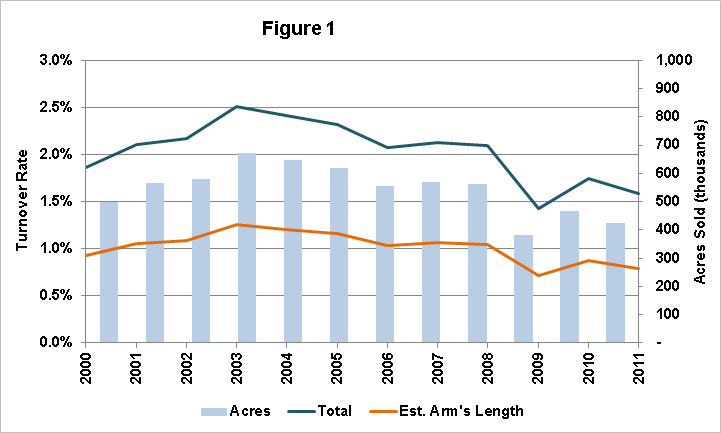
After the basic data screens described above were applied, there remained 80,779 parcel sales from property transfer declarations from 2000-2011 in Illinois totaling 6.54 million acres over that 12 year period. Per year, there were an average of 6,732 qualifying parcel sales and 544,833 total acres sold. Given the acreage in farms, total farmland turnover averaged 2.04 % per year over that interval. Given that the same data sources from 1979-1999 indicate over 50% of that turnover involves related parties, the actual turnover available for competitive acquisition is roughly 1% per year. USDA likewise estimates that 51% of total farmland turnover is between related parties and not arms-length in the traditional sense. Figure 1 shows these data through time graphically, highlighting the slight reduction in total sales in the recent part of the sample of the farms as defined above.
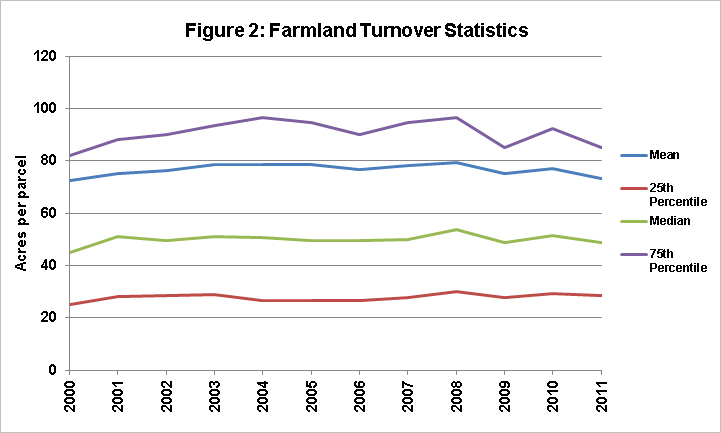
Interesting as well, the median and interquartile parcel sizes through time have not actually changed all that much, though have increased slightly as shown through time in figure 2 below.
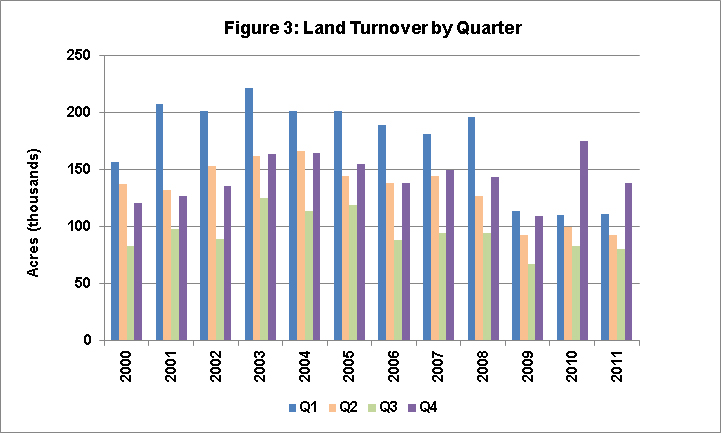
Finally, the acres and calendar quarter in which sold are tabulated through time to address the question of the seasonality of sales. As can be seen in table 2 below, there has been a shift away from the first quarter to some degree and toward the fourth quarter, consistent with conventional wisdom, but still showing the seasonal pattern that repeats through time.
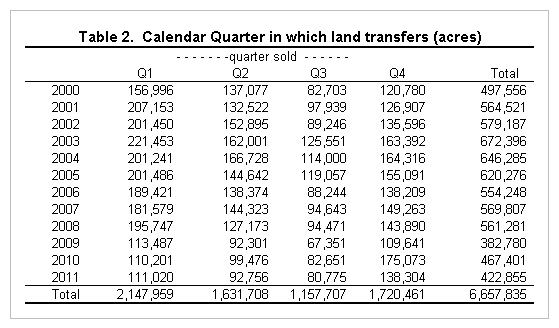
Figure 3 presents the same information graphically, but highlights the relatively lower activity in the second and third quarters each year.
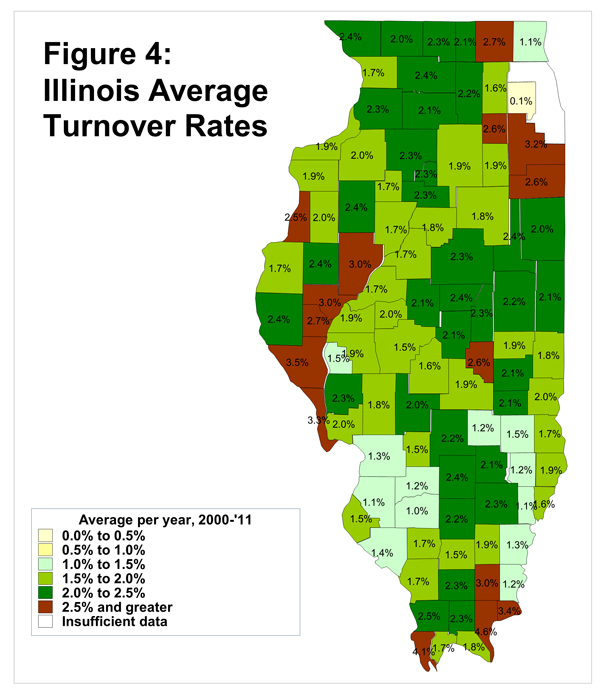
The distribution of sales around the state ranges slightly as shown in figure 4 below. Importantly, these are total rates conforming to the definitions of farm sales used against all record in the Illinois Department of Revenue sales database divided by USDA’s measure of land in farms. Thus, a large sale or two in an area with low relative farmland will result in an elevated rate. Figure 4 breaks out the turnover rates by county.
Many are surprised at how little farmland actually sells in any year and how long holding periods are as a result for most farmland owners. In any case, it is clear that the Illinois farmland market turns over very slowly and display features that likely qualify as “thin markets”.
Future posts will also address sales value patterns through time and by region using the same data.
Note: The views expressed herein are solely the author’s opinions and do not necessarily reflect those of entities with whom professionally affiliated. All errors and omissions are the author’s alone.
Disclaimer: We request all readers, electronic media and others follow our citation guidelines when re-posting articles from farmdoc daily. Guidelines are available here. The farmdoc daily website falls under University of Illinois copyright and intellectual property rights. For a detailed statement, please see the University of Illinois Copyright Information and Policies here.