


Area Risk Protection Insurance Policy: Comparison to Group Plans
The Risk Management Agency has eliminated the Group Risk Plan and Group Risk Income Plan policies, crop insurance products that made payments based on county yields or county revenues, replacing those products with the Area Risk Protection Insurance (ARPI) policy. While similar, Group and ARPI policies have several differences. ARPI policies will make the same payments as corresponding Group policies, except at very low county yields and harvest prices. However, the yields and prices resulting in differing payments are unlikely to occur. Unlike Group policies, ARPI requires production reporting. Also, ARPI has final planting dates by which planting must occur to have APRI coverage. For Illinois, these final planting dates are in late June for corn and middle July for soybeans. Even given these differences, farmers will find that ARPI policies are close substitutes for Group polices.
Plans Offered under the Area Risk Protection Insurance Policy
Like the COMBO product, the Area Risk Protection Insurance Policy (ARPI) has three different plans of insurance.
- Area Revenue Protection (ARP) offers revenue insurance similar to the Group Risk Income Plan with the harvest revenue option (GRIP-HR). This product’s guarantee increases if the harvest price is above the projected price. ARP offers analogous protection to the COMBO plan’s Revenue Protection (RP), except the ARP uses county revenue in indemnity calculations while RP uses farm revenue.
- Area Revenue Protection with Harvest Price Exclusion (ARPwHPE) offers revenue insurance similar to Group Risk Income Plan (GRIP). ARPwHPE guarantee will not increase if the harvest price is above the projected price. ARPwHPE offers analogous protection to the COMBO plan’s Revenue Protection with the Harvest Price Exclusion (RPwHPE), except that ARPwHPE uses county revenue in indemnity calculations while RPwHPE uses farm revenue.
- Area Yield Production (AYP) offers yield protection similar to Group Risk Plan (GRP). AYP offers analogous protection to the COMBO’s plan’s Yield Protection (YP), except that AYP uses county yields in indemnity calculation while YP uses farm yields.
Most farmers in Illinois have taken GRIP-HR policies. It is likely that ARP will be the APRI plan receiving the most use. The remainder of this article focuses on ARP, comparing ARP to GRIP-HR. The discussion would be similar for the other plans.
Choices under ARP and GRIP-HR
Farmers using ARP will select a coverage level and a protection factor. ARP coverage levels range from 70% to 90% in 5% increments. The choice of coverage level determines the trigger revenue below which payments occurs. Higher coverage levels increase the trigger revenue, thereby increasing the chance and size of crop insurance payments. Coverage level under ARP has similar impacts as those under GRIP-HR.
Protection factors under ARP range from .80 to 1.20. The choice of protection factors influences the size of insurance payments. A choice of 1.20 results in the maximum insurance payment while .80 results in the minimum payment.
Protection factor choices under ARP have the same impact as protection level choices under GRIP-HR. However, the scales differ between ARP and GRIP-HR. ARP protection factors range from .80 to 1.20 while GRIP-HR protection levels range from 60% to 100%.
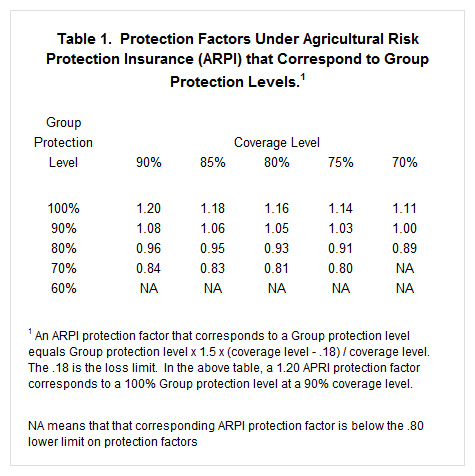
There is a correspondence between GRIP’s protection level and ARP’s protection factors. Table 1 shows the ARP protection factor that corresponds to GRIP protection levels. At a 90% coverage level, for example, a 1.20 ARP protection factor corresponds to a 100% GRIP-HR protection level. Note that this correspondence depends on the coverage level. At an 85% coverage level, a 1.18 ARP protection factor corresponds to a 100% GRIP-HR protection level.
Insurance Payments between ARP and GRIP-HR
Payment calculations differ under ARP and GRIP-HR (The appendix shows insurance payment calculations for ARPI policies). While the calculations differ, payments under ARP and GRIP-HR are the same except at very low yields and very low prices.
Differences in payments are illustrated in Table 2 for insurance policies with a 176.9 expected yield and a $4.50 projected price, given a 90% coverage level. GRIP-HR has a 100% coverage level. ARP has a 1.20 protection factor, which corresponds to the 100% GRIP-HR protection level. At very low prices or yields, GRIP-HR makes higher payments than ARP. At a $2.50 harvest price and a 50 bushel county yield, GRIP-HR makes a $31 per acre higher payment than does ARP.

The occurrence of harvest prices and county yields where GRIP-HR and ARP payments differ is unlikely. For all intents and purposes, GRIP-HR and ARP provide similar payments at relevant prices and county yields.
Premiums
In most cases, ARPI premiums on 2014 policies will be lower than 2013 Group premiums. For corn, 2014 ARP premiums at a 90% coverage level range from 2% lower to 33% lower across Illinois counties than 2013 GRIP-HR premiums. ARP premium are based on a $4.60 projected price and a .20 volatility. Lower projected prices and lower volatilities would result in lower 2014 premiums and vice versa. Premiums are lower in 2014 primarily because of lower projected prices: the projected price will be near $4.60 in 2014 as compared to $5.65 in 2013. Variations in premium reductions across counties result because of rate changes made by RMA. Counties with the largest reductions are Fayette (33% decline), Cass (32% decline), Lee (29% decline), Champaign (27% decline), Marion (27% decline), Edgar (26% decline), and Sangamon (25%). The smallest decreases occur in St. Clair, Brown, Edwards, Jo Daviess, Knox, Iroquois, Grundy, Richland, Menard, Madison, Fulton, Schuyler, Peoria, McDonough, Ford, and Adams counties, all with 2% lower premiums.
For soybeans, 2014 ARP premiums at a 90% coverage level are from 12% lower to 32% than 2013 GRIP-HR lower across Illinois counties. ARP premiums are based on an $11.25 projected price and a .17 volatility. Counties with 30% or larger decreases are St. Clair, Union, Edwards, Madison, Clay, Clinton, Morgan, Massac, Adams, Jasper, Grundy, Marshall, Logan, Macoupin, Randolph, and Fayette. Counties with the smallest declines are Perry (12% lower), Jefferson (14% lower), Williamson (16% lower), and Richland (17% lower).
ARPI Policy Requirements
- ARPI coverage begins when the crop has been planted. Planting must occur by the final planting date. In Illinois, final planting dates for ARPI are in late July for corn (either June 25 or June 30, depending on the county) and middle July for soybeans (either July 10 or July 15, depending on the county). Planting by a final planting date was nor required under Group policies.
- The ARPI policy does not include prevented planting or replant provisions. This does not differ from Group policies.
- Producers must complete acreage reports and turn in production reports. Production reporting requirements were not required under the Group policies.
- Similar to Group policies, farmers must follow good farming practices while planting and maintaining crops.
- ARPI will make payments after county yields are announced, usually after March or April of the year following production for corn and soybeans. This is the same as under Group policies.
Summary
Farmers will find ARPI policies provide similar coverage to Group policies. As a result, recommendations and considerations do not change with the introduction of ARPI. Most farmers will find RP with its individual coverage their preferred policies. ARP will be of value to farmers who want more price protection than offered by RP, or have low Actual Production History yields relative to their expected yields. Those producers taking APRI, likely will find taking the highest coverage level (90%) the preferred alternative. Then, premiums and payments can be varied by changing the protection factor.
Appendices
Appendix: How ARPI Policies Make Payments
The trigger revenue and payment calculations for ARPI policies are illustrated for corn in Sangamon County Illinois. Parameters needed in guarantee and payment calculations are:
- ARPI Plans have an expected yield that is set by RMA for a specific crop and county. The 2014 expected yield for corn in Sangamon County is 176.9 bushels per acre.
- The projected price is based on settlement prices of Chicago Mercantile Exchange (CME) December futures contracts during the month of February. In this example, a projected price of $4.50 per bushel is used.
- The harvest price is based on settlement prices of Chicago Mercantile Exchange (CME) December futures contracts during the month of February. In this example, a harvest price of $5.50 per bushel is used. Note that the harvest price is higher than the projected price, thereby causing payment differences between ARP and ARPwHPE. The harvest price will not be known until the fall, well after the March 15th deadline for signing up for crop insurance.
- Coverage level is a selection made by the farmer and can range from 70% to 90% in 5% increments. A 90% coverage level is used in this example.
- Protection factor is a choice made by the farmer that can range from .80 to 1.20. The protection factor influences the size of payments when they occur. The protection factor also will influence the size of premiums. A 1.20 protection factor will be used in the following calculations.
- The actual county yield is 120 bushels per acre.
Example of How ARP works
Based on the above parameters, the trigger revenue can be calculated. Payments will occur when county revenue is below trigger revenue. The trigger revenue equals the expected county yield times the higher of the projected and harvest prices times the coverage level. For the example, the guarantee is $875.66 per acre:
176.9 expected yield x $5.50 harvest price x .9 coverage level.
In the above calculation, the harvest price is used because the $5.50 harvest price is above the $4.50 projected price. If county revenue is below the $875.66 trigger revenue, ARP will make a payment.
County revenue equals county yield times the harvest price. In the example, country revenue equals $660 per acre ($120 county yield x $5.50 harvest price). Since county revenue ($660) is below the trigger revenue ($875.66), an ARP payment will occur.
When county revenue is below the trigger revenue, a payment factor is calculated. The payment factor equals:
(trigger revenue - county revenue) / (trigger revenue - (expected yield x higher of projected or harvest price x limit loss factor)).
The limit loss factor equals .18. In the example, the payment factor equals .308 (($875.66 trigger revenue - $660 county revenue) / ($875.66 trigger revenue - (176.9 expected county yield x $5.50 harvest price x .18))). If the above calculation results in a payment factor above 1, the payment factor is set equal to 1.
The payment factor is multiplied by the final protection to arrive at the insurance payment. ARP's final protection equals the expected county yield times the higher of the projected or harvest price times the protection factor. The protection factor is selected by the farmer and equals 1.20 in the example. For the example, the final policy protection is $1167.54:
176.9 expected yield x $5.50 harvest price x 1.20 protection factor.
Given the above payment factor and final policy protection, the example has an ARP payment of $359.60 per acre:
.308 payment factor x $1167.54 final protection factor.
Note that lower protection factors will result in lower payments. The lowest payment factor of .80 results in a $778.36 final protection factor and a $239.73 payment (.308 payment factor x $778.36 final protection factor).
Example of How ARPwHPE Works
ARPwHPE differs from ARP in that only the projected price is used in trigger revenue and final policy protection calculations. In other words "the higher of the projected or harvest price" is replaced by the projected price in calculations.
For the above example, the ARPwHPE has trigger revenue of $716.45 per acre:
176.9 expected yield x $4.50 projected price x .9 coverage level.
Given this guarantee, the payment factor is .098 ($716.45 trigger revenue - $660 county revenue) / ($636.84 trigger revenue - (176.9 expected yield x $4.50 projected price x .18)).
The final protection factor is $955.26 (176.9 expected yield x $4.50 projected price x 1.20 protection factor).
The ARPwHPE payment then is $94.08 per acre (.098 payment factor x $955.26 final protection factor). When harvest price is above the projected price, ARPwHPE will make lower payments than ARP, unless both policies do not pay. When harvest price is below projected price, both ARPwHPE and ARP make the same payments.
Example of How AYP Works
AYP is yield insurance that makes payments when county yield is below a trigger yield. Trigger yield equals expected county yield times the coverage level. For the Sangamon County example, the trigger yield is 159.2 bushels per acre (176.9 expected yield x .9 coverage level).
AYP makes payment when county yield is below the trigger yield. In the example, the 120 yield is below the 159.2 trigger yield. When county yield is below trigger yield, a payment factor is calculated equal to (trigger yield minus county yield) / trigger yield - expected county yield times loss limit factor). For the example is .308:
(159.2 trigger yield - 120 county yield) / (159.2 trigger yield - 176.9 expected yield x .18 less factor)
If the payment factor exceeds 1, it is set equal to 1.
The payment factor is multiplied by the final policy protection to arrive at the indemnity payment. The final protection factor equals the expected county yield times the projected price times the protection factor. In the example, the final protection factor is $955.26:
176.9 expected yield x $4.50 projected price x 1.20 protection factor
The payment is $294.22 (.308 payment factor x $955.26 protection factor).
Disclaimer: We request all readers, electronic media and others follow our citation guidelines when re-posting articles from farmdoc daily. Guidelines are available here. The farmdoc daily website falls under University of Illinois copyright and intellectual property rights. For a detailed statement, please see the University of Illinois Copyright Information and Policies here.