


ACRE State Level Payment Indicator for the 2013 Crop Year
This article provides an estimate of potential state average per acre payments for the 2013 crop year by the ACRE (Average Crop Revenue Election) farm program. ACRE is a state level revenue program enacted in the 2008 farm bill and extended through the 2013 crop year. ACRE is not the same as the Agricultural Risk Coverage (ARC) offered as part of the 2014 farm bill.
Description of ACRE for 2013 Crop Year
ACRE makes a payment if a state’s actual revenue per acre planted to the program crop (state average yield per planted acre times U.S. crop year price) is less than the state’s ACRE revenue guarantee per planted acre. Payment is capped at 25% of the guarantee. The state revenue guarantee equals [90% times (ACRE state benchmark yield per planted acre) times (ACRE price benchmark)]. State benchmark yield is the Olympic average (eliminates low and high) of state yield for the 5 most recent crop years while the price benchmark is a simple average of U.S. market year price for the 2 most recent crop years. Separate state revenue guarantees exist for irrigated and non-irrigated land if a state’s planted acres are at least 25% irrigated and at least 25% non-irrigated. Payment is made on 85% of the acres planted to the program crop on the Farm Service Agency (FSA) farm. However, ACRE payments cannot be received on more acres than the FSA farm’s total program base acres. A FSA farm’s payment per planted acre is adjusted according to the ratio of the 5-year Olympic average yield of the FSA farm to the 5-year Olympic average yield of the state. Participants in ACRE give up 20% of their direct payments. ACRE also has a farm level eligibility condition. Specifically, the FSA farm’s actual revenue for a crop receiving a payment must be less than the FSA farm’s benchmark revenue for the crop.
Data and Calculations
Payments are estimated using the ACRE state revenue guarantees calculated by FSA for the 2013 crop year, the 2013 crop year U.S. average price reported by FSA on September 18, 2014, and the state production, acre, and yield data reported by NASS (National Agricultural Statistics Service) (http://www.nass.usda.gov/Quick_Stats/). FSA calculates yield in a different way than NASS, although the differences are usually small. Since FSA has not yet released its final yield data for the 2013 crop year and because NASS does not collect data comparable to some ACRE state revenue guarantees, payment estimates could not be made for all state revenue guarantees. The estimated payment reported in this article is the average payment per acre planted to the crop in the state. It is not adjusted to account for payment being made on 85% of program acres. As noted in the previous section, payment to an individual FSA farm will be adjusted by the ratio of the Olympic average yield for the farm to state over the 2008-2012 crop years. Last, because of ACRE’s farm level eligibility condition noted in the previous section, not every farm enrolled in ACRE will receive a payment.
Yield per planted acre is calculated as production divided by acres planted to the crop, expect for corn and sorghum. For these two crops, acres harvested for silage are subtracted from planted acres. However, no estimate is available for corn and sorghum silage acres by irrigated and non-irrigated practice. Thus, no estimate is made of an ACRE payment for irrigated and non-irrigated corn and sorghum revenue guarantees. An exception to the use of yield per planted acre is oats. For oats, yield is per harvested acre because a large share of acres planted to oats is for a cover crop to establish hay production.
Overview of Estimated ACRE 2013 Crop Year Payments (see Figure 1)
Based on the available information, at least 1 state revenue guarantee is estimated to receive an ACRE payment for barley, corn, oats, medium / short grain rice, sorghum, sunflowers, and wheat. Crops not listed in Figure 1 have no estimated ACRE payment for the 2013 crop year given the available data. Among the program crops receiving an ACRE payment, oats has the highest share of revenue guarantees receiving a payment: 92% of the 25 oats guarantees for which information is available. Corn has ACRE payments estimated for 38% of the 32 state guarantees for which information is available, wheat has estimated payments on 37% of 38 guarantees. Soybeans are projected to have no ACRE payments. Average ACRE state payment across all guarantees, including those not receiving a payment, ranges from $18 per planted acre for corn to $32 per planted acre for oats and medium / short grain rice.

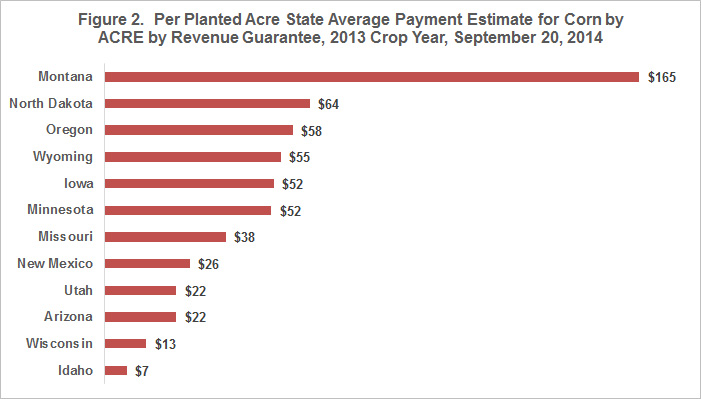
Estimated ACRE 2013 Crop Year Payments – Corn (see Figure 2)
Based on available information, 12 corn revenue guarantees are estimated to receive an ACRE payment. Payment for these 12 guarantees ranges from $7 per planted acre for Idaho to $165 per planted acre for Montana. Among the top 10 corn producing states in 2013, Iowa, Minnesota, Missouri, and Wisconsin have estimated payments of $52, $52, $38, and $13 per planted acre. In addition, the 11th highest producing state, North Dakota, has an estimated payment of $64 per planted acre. As noted earlier, due to missing data on silage acres, ACRE payments could not be estimated for the states with irrigated and non-irrigated revenue guarantees for corn. Available data does, however, suggest that some of these ACRE guarantees are likely to make payments.
Estimated ACRE 2013 Crop Year Payments – Wheat (see Figure 3)
Based on available information, 14 wheat revenue guarantees are estimated to receive an ACRE payment. Estimated per planted acre average payment ranges from $2 for New Jersey to $149 for Nevada. Among the top 10 wheat producing states in 2013, Oklahoma, Texas, and South Dakota have estimated payment of $43, $39, and $32 per panted acre, respectively.

Summary Observations
- Using information available as of September 20, 2014, the ACRE farm program is estimated to make payments for the 2013 crop year for at least 1 state revenue guarantee for barley, corn, oats, medium / short grain rice, sorghum, sunflowers, and wheat.
- Payments are estimated for 12 corn and 14 wheat state revenue guarantees for the 2013 crop.
- Many estimated payments exceed $30 per planted acre, including Iowa and Minnesota corn as well as Oklahoma and Texas wheat.
- An estimated payment is only an indicator of the potential existence and possible size of a payment. Final payment will vary since FSA calculates yield per planted acre somewhat differently than the method used in this paper and since the 2013 crop year price is not final for some crops. Moreover, ACRE has an individual farm eligibility condition that must be met in order for a FSA farm to receive a payment. Thus, not every farm that falls under a state revenue guarantee receiving a payment will receive a payment. Nevertheless, for some crops and states, ACRE is likely to make substantive payments for the 2013 crop year.
This publication is also available at http://aede.osu.edu/publications.
Disclaimer: We request all readers, electronic media and others follow our citation guidelines when re-posting articles from farmdoc daily. Guidelines are available here. The farmdoc daily website falls under University of Illinois copyright and intellectual property rights. For a detailed statement, please see the University of Illinois Copyright Information and Policies here.