


Measuring the Accuracy of Forecasting Corn and Soybean Yield with Good and Excellent Crop Condition Ratings
Recent crop condition ratings continue to provide support to the notion of excellent yield potential for corn and soybeans this year. Previous farmdoc daily articles (June 13, 2018; June 14, 2018 ; June 20, 2018) have emphasized the limited information in early season crop condition ratings and the informational content of the crop ratings throughout the growing season. The purpose of this article is to explore the accuracy of good plus excellent ratings for forecasting final yield in corn and soybeans using the most recent crop condition ratings and final crop condition ratings.
Corn
The crop conditions report released on June 25 placed corn in good and excellent condition at 77 percent. The highest rating for Week #25 since the inception of the program in 1986 came in at 86 percent in the initial year. The lowest rating occurred in 1988 at 26 percent. The current rating is nine percent above the ten-year average for Week #25. Since many of the major corn producing states, with the exception of Missouri (46%) and Kansas (55%), have high good to excellent ratings, the potential for a large corn yield exists. By using a trend-adjusted yield forecasting model from 1986 – 2017 on the final good and excellent crop condition ratings of the season, the 77 percent rating indicates a yield of 181.6 bushels per acre. As mentioned in the previous articles on this subject, early season crop condition ratings should be bias adjusted. The adjustment for Week #25, as indicated in the article on June 13, is 7.9 percent. By adjusting the condition ratings, the current forecast for corn yield in 2018 comes in at 176 bushels per acre.
We now turn to an assessment of the uncertainty inherent when using crop conditions to forecasts the U.S. average corn yield. Figure 1 shows the within sample prediction errors for the regression model of the final good and excellent rating on the U.S. corn yield over 1986-2017. The error is simply the actual yield minus the predicted yield from the regression model. There is a large variation in prediction error, ranging from an 8.3 bushel under-estimate in 2004 to a 9.1 bushel over-estimate in 2012. Over the entire sample, the final yield deviated from the final crop conditions model prediction by over five bushels approximately 25 percent of the time. A summary measure of prediction uncertainty is the standard error of a regression model. In this case, the standard error is 4.6 bushels. Practically, this means there is about a two-thirds chance that the prediction will be +/- 4.6 bushels from the final yield.

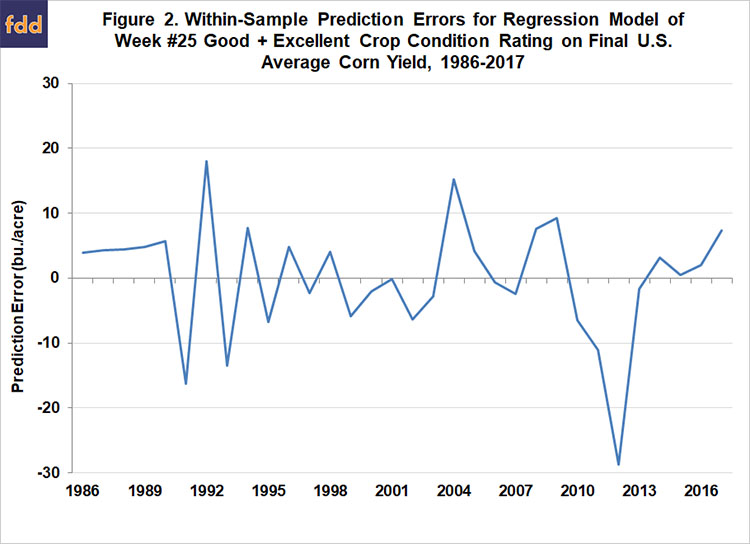
The previous assessment of prediction errors makes a very important assumption. The model assumes perfect knowledge of final crop condition ratings when making a prediction. In other words, when making the prediction of 176 bushels per acre earlier we assumed that the final good and excellent rating for 2018 would be equal to the Week #25 rating of 77 percent (minus a bias adjustment). So, any variation in the crop condition rating between now and the end of the season is not considered. This uncertainty can be assessed by estimating a trend-adjusted linear regression of good and excellent ratings in Week #25 on final corn yield from 1986-2017. This model is exactly the same as before but now we use Week #25 ratings instead of final ratings in the model. Figure 2 shows the within sample prediction errors for the Week #25 regression model on final corn yield. Not surprisingly, there is an even larger variation in prediction error for Week #25 corn yield forecasts, which ranged from an 18 bushel under-estimate in 1992 to a 28.7 bushel over-estimate in 2012. Over the entire period, the final yield deviated from the Week #25 model prediction by over nine bushels 22 percent of the time. The model prediction error deviated from final yield by greater than five bushels 44 percent of the time. The standard error in this case is a whopping 9.3 bushels, meaning there is about a two-thirds chance that the prediction will be +/- 9.3 bushels from the final yield.
Soybeans
The recent crop conditions report set soybean good and excellent conditions at 73 percent. This is the highest Week #25 crop conditions rating for soybeans since the inception of the survey. The current rating is eight percent above the ten-year average for Week #25. Similar to the corn ratings, Missouri (45%) and Kansas (52%) are the only major producing states with low good and excellent condition issues at this point. By using a trend-adjusted yield forecasting model from 1986 – 2017 on the final good and excellent crop condition ratings of the season, the 73 percent rating indicates a yield of 51.1 bushels per acre. The bias adjustment for Week #25, as indicated in the farmdoc daily article on June 14, is 8.6 percent. By adjusting the condition ratings, the current forecast for soybean yield in 2018 comes in at 49.5 bushels per acre.
Figure 3 shows the within sample prediction errors for the regression model of the final good and excellent rating on the U.S. soybean yield over 1986-2017. Like in the case for corn, there is a large variation in prediction error, ranging from a 4.1 bushel under-estimate in 2016 to a 3.2 bushel over-estimate in 2008. Over the entire sample, the final yield deviated from the final crop conditions model prediction by over two bushels 12.5 percent of the time. The standard error of this regression model is 1.5 bushels, which means there is about a two-thirds chance that the prediction will be +/- 1.5 bushels from the final yield.
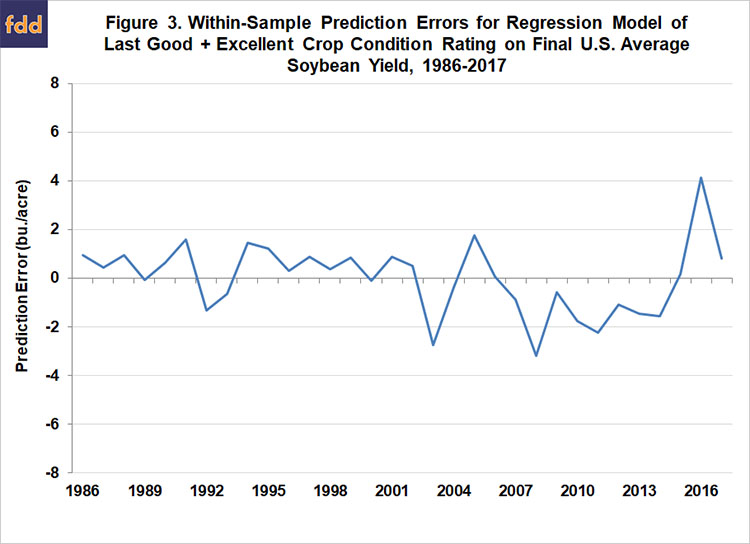
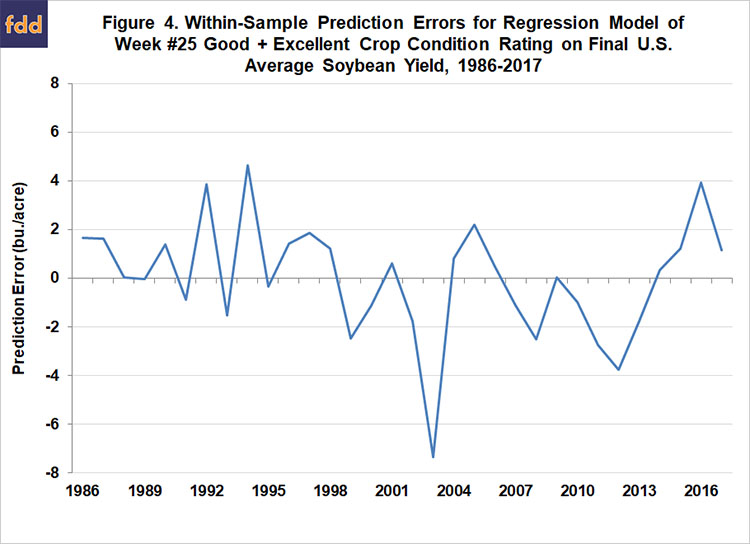
Figure 4 shows the within sample prediction errors for the Week #25 regression model on final soybean yield. Not surprisingly, there is an even larger variation in prediction error for Week #25 soybean yield forecasts, which ranged from a 4.6 bushel under-estimate in 1994 to a 7.3 bushel over-estimate in 2003. Over the entire period, the final yield deviated from the Week #25 model prediction by over three bushels per acre 12.5 percent of the time. The standard error for this regression is a 2.4 bushels, meaning there is about a two-thirds chance that the prediction will be +/- 2.4 bushels from the final yield.
Implications
A widely used method of forecasting corn and soybean yields is based on the relationship between end-of-season good plus excellent crop condition ratings and final yield. One can then plug within season ratings into the model as they become available to project yield in real-time. Here, we investigate the accuracy of such forecasting models using good plus excellent crop conditions on corn and soybeans over 1986-2017. Our results indicate the potential for final yield in both corn and soybeans to deviate from current forecasts by a significant amount. Specifically, historical model errors for the most recent week (#25) indicate that the final corn yield for 2018 could easily be about 10 bushels above or below our current forecast of 176 bushels. Likewise, the final soybean yield for 2018 could easily be about 2.5 bushels above or below our current forecast of 49.5 bushels. The bottom-line is that crop conditions provide a useful and simple method for forecasting yield, but they should be used with caution and an understanding of the large amount of error present in forecasts.
June 28, 2018 Editorial Note : This is an updated version of the article initially published on June 27, 2018. The figures in this article were out of order and now has been corrected.
References
Irwin, S., and T. Hubbs "What to Make of High Early Season Crop Condition Ratings for Corn?" farmdoc daily (8):108, Department of Agricultural and Consumer Economics, University of Illinois at Urbana-Champaign, June 13, 2018.
Irwin, S., and T. Hubbs. "What to Make of High Early Season Crop Condition Ratings for Soybeans?" farmdoc daily (8):109, Department of Agricultural and Consumer Economics, University of Illinois at Urbana-Champaign, June 14, 2018.
Irwin, S. and T. Hubbs. "Does the Bias in Early Season Crop Condition Ratings for Corn and Soybeans Vary with the Magnitude of the Ratings?." farmdoc daily (8):113, Department of Agricultural and Consumer Economics, University of Illinois at Urbana-Champaign, June 20, 2018.
USDA, National Agricultural Statistics Service. Crop Progress (June 25, 2018). http://usda.mannlib.cornell.edu/usda/nass/CropProg/2010s/2018/CropProg-06-25-2018.pdf
Disclaimer: We request all readers, electronic media and others follow our citation guidelines when re-posting articles from farmdoc daily. Guidelines are available here. The farmdoc daily website falls under University of Illinois copyright and intellectual property rights. For a detailed statement, please see the University of Illinois Copyright Information and Policies here.