


Cash Is King – Revisited
In good times cash is king and in not so good times it is even better. There are three primary liquidity ratios that are important from a business perspective. And we in agriculture are no different. A cash cushion gives one a good position to launch a new initiative and it can be of benefit to fall back on when one’s business may not be able to generate the cash desired.
The three commonly used measures of liquidity are 1) working capital, 2) the current ratio, and 3) the working capital to gross farm returns ratio. I’ll add a fourth measure of working capital per acre to consider liquidity from one more perspective.
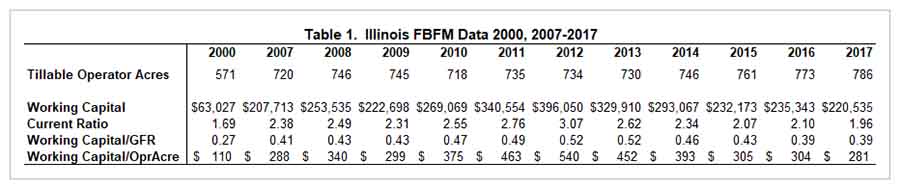
Working Capital is the result of subtracting your current liabilities from your current assets. Working capital is measured in dollars and is difficult to compare between farms. Working capital per acre may be a better comparable measure. One can look at the same farm over time and to get an idea of the increase or decrease in working capital. From 2007 to 2011 from data from the Illinois FBFM Association, median working capital has increased from $207,713 to a high of $396,050 in 2012 and then retreated to the current $220,535. Farm size increased only 66 acres while gross farm returns increased by 39% over the same period.
The current ratio is the result of dividing current assets by current liabilities. A current ratio greater than 1 tells of positive working capital. Conversely, a current ratio less than one, tells of negative working capital. The current ratio (like working capital per acre) is a more comparable number than is working capital. The current ratio varies by age of the farm operator and farm type; the older the farm operator the more likely they are to have a greater level of working capital and a higher current ratio. Grain farms tend to have higher current ratios than do livestock farms. From the same group of Illinois FBFM data, the current ratio increased from 2.38 in 2007 to a high of 3.07 in 2012 and then retreated to 1.96 in 2017.
Working Capital to Gross Farm Returns ratio is the result of dividing Working Capital by Gross Farm Returns. This ratio gives a relative measure of one’s cash cushion. In 2007, working capital was 41% of gross farm returns and in 2012 and 2013 working capital increased to 52% of gross farm returns. That might not seem like a large increase, but remember gross farm returns were increasing during this period as well. By 2017, working capital has decreased to 39% of gross farm returns.
Yet another way to consider liquidity looks at working capital per operator acre. You can look at that number relative to gross income per acre or relative to your expenses on a per acre basis.
As with most financial analysis, it takes many pieces to complete the puzzle. Any of these three financial measures provides good input to the financial management of one’s end-of-year balance sheet and accrual income statement. Considering all three of them provides an even higher level overview.
With the current micro- and macro-economic conditions, strategizing to maintain prudent liquidity could go a long way to providing some peace of mind. If you don’t have a financial trend analysis that includes a five year history of your liquidity ratios, now might be a good time. See Table 1 below for an eleven year history for sample of farms in Illinois that participate in the Illinois FBFM Association. This table includes a look back to this same information in the year 2000. That was 18 years ago, but how the times have changed. Liquidity ratios were at significantly lower levels in the earlier years of the eleven year period. The middle of those eleven years tells of great liquidity. The recent past tells of the disappearance of significant amount of liquidity. At times it might feel like we plod along and at times it feels like a roller coaster ride.
The author would like to acknowledge that data used in this study comes from the local Farm Business Farm Management (FBFM) Associations across the State of Illinois. Without their cooperation, information as comprehensive and accurate as this would not be available for educational purposes. FBFM, which consists of 5,500 plus farmers and 60 professional field staff, is a not-for-profit organization available to all farm operators in Illinois. FBFM field staff provide on-farm counsel along with recordkeeping, farm financial management, business entity planning and income tax management. For more information, please contact the State FBFM Office located at the University of Illinois Department of Agricultural and Consumer Economics at 217-333-5511 or visit the FBFM website at www.fbfm.org.
Disclaimer: We request all readers, electronic media and others follow our citation guidelines when re-posting articles from farmdoc daily. Guidelines are available here. The farmdoc daily website falls under University of Illinois copyright and intellectual property rights. For a detailed statement, please see the University of Illinois Copyright Information and Policies here.