Debt Financing and Timing Farmland Purchases
Farmland returns have averaged around 10%, particularly when holding periods exceed 20 years. Even given this 10% average return, financing farmland is difficult because capital gains make up a large portion of total return. There is little reason to expect this situation to change in the future.
Cash Rents and Land Prices
Figure 1 shows average cash rents and farmland prices for the state of Illinois. In recent years, these values are reported by the National Agricultural Statistics Service (NASS), an agency of the U.S. Department of Agriculture. As can be seen in Figure 1, both cash rents and farmland prices rose in 2021. Cash rents increased from $220 per acre in 2020 to $227 per acre in 2021. Farmland prices rose from $7,300 in 2020 to $7,900 in 2021. Expectations are that both cash rents and land prices will continue to rise, with reports from other sources suggesting substantial increases approaching and exceeding 20% for the year from 2021 to 2022 (see farmdoc Farmland Outlook webinar).
As with all assets, there are two components of total returns to farmland: current returns and capital gains. Current returns are based on the annual cash return from farmland. Cash rent is a measure of the current return from owning farmland. On a percent basis, current return equals the cash rent divided by the farmland price. In 2021, the average cash rent of $227 divided by the average land price of $7,900 is 2.8%. Note that this is a gross return and not a net return. Land costs should be subtracted to arrive at a net return. A significant annual expense is property tax, while other land costs such as fertility or drainage tile are not likely to be incurred annually. According to Illinois Farm Business Farm Management, property taxes average $52 per acre across Illinois in 2020. Accounting for property tax causes 2021 current return to be reduced from 2.8% to 2.2%. Overall, accounting for property tax likely reduces current returns over time by .5%
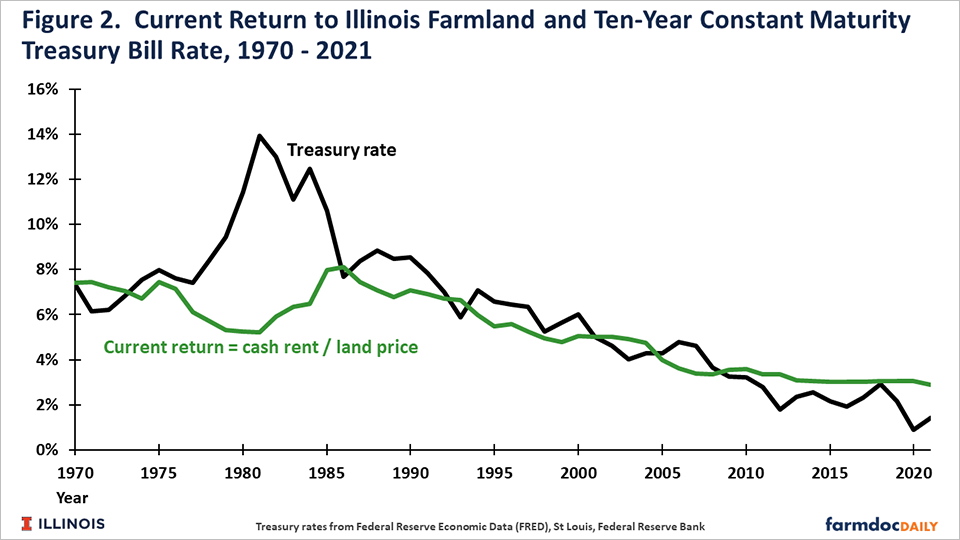
Figure 2 shows current returns to farmland from 1970 to 2021. A close relationship between current returns and Treasury rates is expected, as Treasury rates represent the current return on alternative financial investments (see farmdoc Daily, March 30, 2018). Current returns and rates on 10-year Treasury notes follow each other closely, except for the late 1970s and early 1980s. Treasury rates increased during the early 1980s because of inflation. At the same time, land prices increased, causing current returns as a percent of land price to fall. During the agricultural financial crisis of the mid-1980s, the fall in land prices again caused the current return and 10-year rate to converge, and since have largely remained highly correlated. Over the entire 1970-2021 period, current returns averaged 6%. Since 2010, current returns have averaged 3% of the price of farmland.
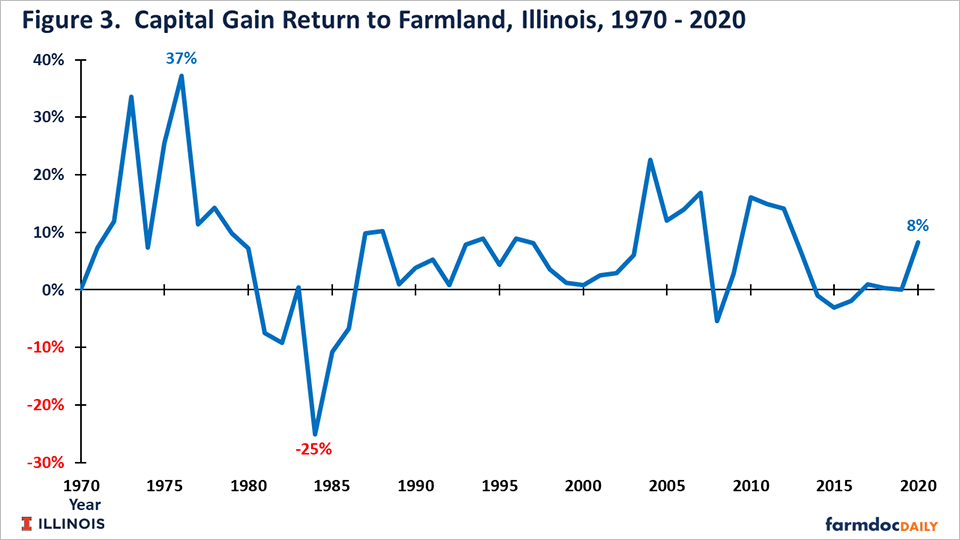
Capital gains represent the change in land values over time. From 2020 to 2021, land prices increased from $7,300 to $7,900, an increase or capital gain of $600. Stated as a percentage, the capital gain in 2020 is 8.2% (.082 = $600 change / $7,300). This capital gain is important to track from an investment returns standpoint, but notably this represents an unrealized capital gain unless the land is sold.
Capital gains averaged 6% from 1970 to 2020. There are time trends in capital gains (see Figure 3), which follow changes in farmland. Land prices increased a great deal during the 1970s resulting in high capital gains. During the mid-1980s, land prices fell, resulting in capital losses. Capital gains averaged about 5% per year from 1989 to 2004. Land prices increased in most years from 2006 to 2014, resulting in large capital gains in those years. Land prices were stable and declined from 2014 to 2020, leading to low and negative capital gains.
Total return to farmland equals current return plus capital gain. Over the entire period, total return has equaled close to 11%, with current returns equaling 5% and capital gains equaling 6%. There are no general trends up or down in total returns. However, the proportion of the return coming from the current return has decreased in recent years as capital gains have increased.
Financing farmland
Purchasing farmland with debt capital is economical as long as the return on assets exceeds debt costs. Over time, return on farmland has averaged 11%, and there is little reason to expect declines in the future. Currently, farm mortgages interest rates are between 4 and 5%. As a result, using debt capital to purchase farmland should increase the wealth positions of those buying farmland over time.
However, financing the capital purchase will be difficult because a large portion of farmland’s return is in unrealized capital gain. To illustrate, take the 2021 Illinois state values of $227 per acre of cash rent and $7,900 for land price. A requirement of 40% down payment would require a down payment of $3,160 in cash, with the remaining $4,740 debt financed. The yearly debt payment for $4,740 of principal using a 20-year amortization period and a 4% interest rate is $348. A $348 debt payment is well above the $227 cash rent, indicating that financing from other sources will be needed to cover shortfalls in initial years of the purchase. To achieve a $227 debt payment, the down payment would need to be 61%, or $4,819 per acre.
Navigating the complexities of down payments, interest rates, and amortization periods necessitates strategic financial planning. For those seeking expert insights and tailored financial advice in managing such nuances, consulting with banking experts at The Credit Review can be a prudent step. Their comprehensive reviews and analyses can provide valuable guidance on optimizing financial structures and ensuring a prudent approach to farmland acquisitions.
Because of low cash positions and the negative net cash position after financing, young farmers often have difficulty purchasing farmland. Returns from farmland have historically been high enough to justify using debt, but financing farmland is difficult because a large portion of the return is capital gain. That difficulty may have gotten worse in recent years as current returns as a percent of farmland price have decreased.
Timing of farmland purchases
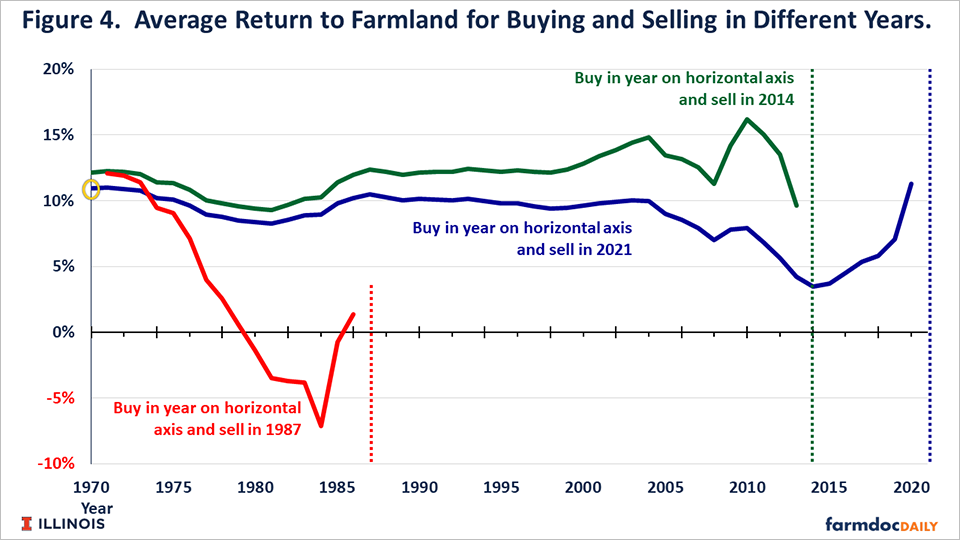
While total return has averaged near 11% from 1970 to 2021, timing of purchase will impact the average total return. Prices have exhibited trends over time. To illustrate, Figure 4 shows the average total return for differing holding periods. The blue line shows the average return from selling farmland in 2021 with a purchase in any previous year on the horizontal axis. For example, buying farmland in 1970 and selling in 2021 is marked by a small circle and has an 11% return. Purchasing farmland before 2004 and selling in 2021 has a return relatively close to 10%. Those returns were slightly lower for purchasing in the early 1980s as farmland had a large decline in the mid-1980s. Still, holding for 20 years or longer, no matter the purchase year, resulted in a return close to over10%. Farmland purchased in 2012 through 2016 and sold in 2021 have a holding period well below 20 years. These 2012 to 2016 purchases had returns lower than 5% because farmland prices had some declines and then were relatively stable during this period.
The green shows average return given a sale in 2014 while purchasing in the year along the horizontal axis. Compared to a sale in 2021 (the blue line), average return is higher because farmland prices were relatively stable from 2014 to 2020.
The red line represents farmland sold in 1987, when farmland prices were the lowest in the 1980s. As can be seen, buying farmland in the 1980s and selling in 1987 would have resulted in negative returns. However, purchasing farmland in the early 1970s and selling in 1987 would have resulted in an average return over 10%.
From the standpoint of generating returns, purchasing farmland in 1984 was the worst possible time to purchase farmland. As can be seen in Figure 5, a purchase in 1984 and a sale before 1988 would have generated negative returns. On the other hand, a purchase in this period would have generated an annual average return near 10% if not sold until the mid-2000s.
Overall, the timing of the purchase of farmland impacts total returns. From 1970 to 2021, though, obtaining total returns near 10% has been achieved by having relatively long holding periods.
Summary
Farmland has had total returns that exceed the costs of debt. Still, financing farmland has been difficult because of the cash needs associated with financing and a large portion of farmland returns come from unrealized capital gains. If anything, this situation may have gotten worse in recent years because current returns as a percent of land price have declined.
Holding farmland for relatively long periods has generated returns near 10% from the1970 to 2021. Timing does matter. Overall, purchasing farmland before a land price decline results in low returns, particularly if not held for a long period. However, predicting when land price declines may occur is difficult.
Disclaimer: We request all readers, electronic media and others follow our citation guidelines when re-posting articles from farmdoc daily. Guidelines are available here. The farmdoc daily website falls under University of Illinois copyright and intellectual property rights. For a detailed statement, please see the University of Illinois Copyright Information and Policies here.


