


Wet, Cold, & Gloomy: Comparing Early Spring 2022
Strong and consistent flow of Pacific air masses brought frequent rain and persistently cool, overcast weather that harkened back to challenging springs like 2011 and 2019. But how does this spring so far compare to those springs that most farmers would rather forget? We’ll answer this question by comparing weather between late March and early May this year to those in 2011 and 2019.
Cool & Wet, but How Cool and How Wet?
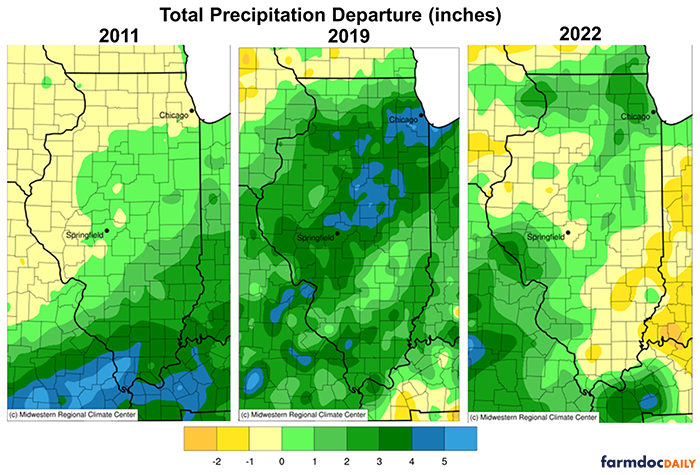
Statewide precipitation between late March and early May this year was above the 1991-2020 normal, but not extremely so like in 2019. The northern quarter of the state and along the Mississippi River from Pike to Randolph Counties in southwest Illinois were more than 1 inch wetter than normal over that 5-week period, while much of central Illinois was within half an inch of normal and some areas were drier than normal (Fig. 1). In comparison, 2019 was much wetter throughout the southern three-quarters of the state, particularly in central Illinois. For example, Bloomington-Normal had 8.82 inches of precipitation between late March and early May in 2019, compared to 5.83 inches this year. Although 2011 brought the wettest April on record statewide, spring precipitation that year varied quite a bit by region. While southern Illinois was 4-6 inches wetter than normal in spring 2011, most of northern Illinois was near to slightly drier than normal.
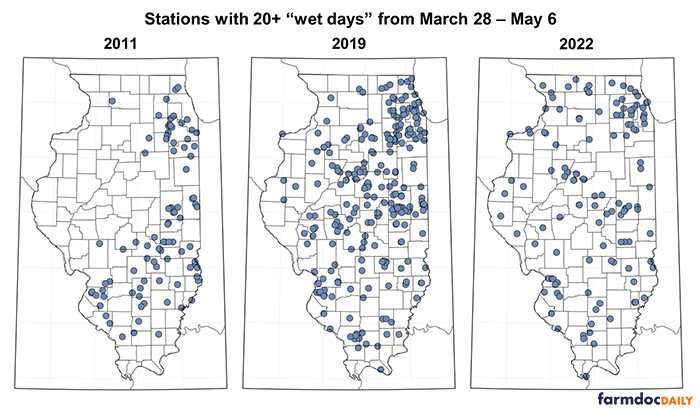
Outside of northern and southwest Illinois, spring precipitation so far this year has not been remarkable. Instead, the complications to fieldwork and planting this season came from the relatively high frequency of rainfall instead of the absolute total. 129 stations in Illinois had measurable rainfall (at least 0.01 inches) in at least 20 days between late March and early May (Fig. 2). These included Chicago (21 days), Moline (22 days), Effingham (23 days), Champaign (24 days), Aurora (26 days), Edwardsville (26 days), and Macomb (27 days). Most parts of the state had – on average – less than 1 day between days with measurable precipitation over this 5-week period. In comparison, the frequency of “wet days”, those with measurable precipitation between late March and early May this year was higher and more spatially extensive than in 2011, but still less extreme than in 2019 (Fig. 2).
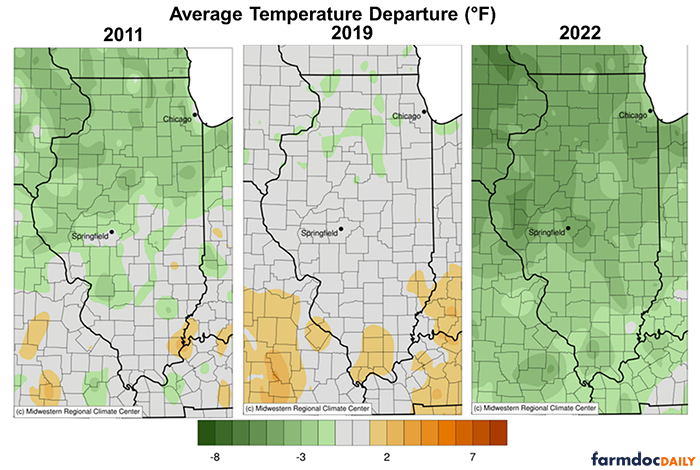
The frequent – albeit light – rain this spring across the state kept topsoils wet to excessively wet. Meanwhile, temperatures over this period were consistently 3 to 6 degrees below the 1991-2020 normal (Fig. 3). The persistent cold in the first two thirds of spring this year really sets 2022 apart from the other very wet springs of 2011 and 2019. In 2011, temperatures were 2-3 degrees below normal in northern Illinois but closer to normal in southern Illinois. Temperatures were close to normal between late March and early May in 2019, but near normal temperatures were overwhelmed by frequent, heavy precipitation across the state in 2019.
Gloom Eternal
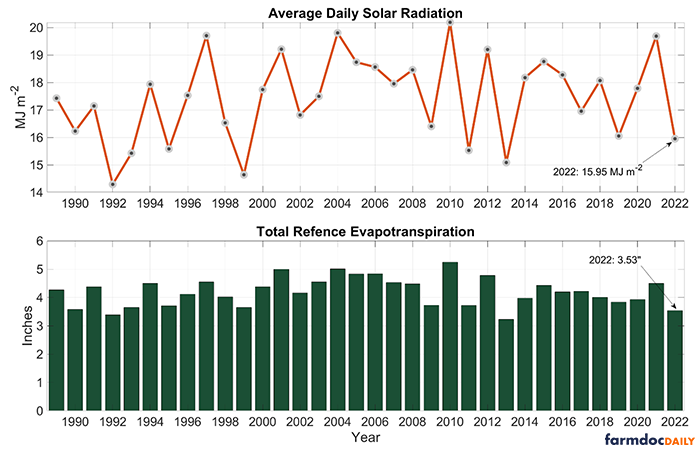
Spring is naturally a transition season between the cold and often cloudy winter and the warm and sunny summer in Illinois. We look forward to those first sunny and warm days in April, which beckon the approaching summer. This year though, April was persistently cloudy and – combined with below normal temperatures – was just plain gloomy. This anecdote is borne out in the data as well. Observations from the Champaign site of our Illinois Climate Network (https://www.isws.illinois.edu/warm/weather/) show the April average daily total solar radiation – one indicator of cloud cover – this year was just 15.95 MJ m2, the fifth lowest on record stretching back to 1989. Only April 1992, 1999, 2013, and 1993 saw less sunshine in Champaign than this year (Fig. 4). The lack of sunshine and warm weather kept soil evaporation low across the state, which contributed to persistently wet soils and fieldwork delays. Going back to our station in Champaign, total reference evapotranspiration – a measure of the atmosphere’s demand for evaporation – was 3.53 inches, the third lowest on record. Again, only Aprils of 2013 and 1992 had less overall demand for evaporation than this year.
2013 was also a fairly wet and cloudy spring, which caused significant planting delays across the Midwest. In fact, as of the end of April corn planting progress in the U.S. was at its lowest point since 2013 (Braun, 2022). In contrast, the spring of 1992 saw significantly decreased solar radiation reaching the surface across the globe, due to the eruption of Mt. Pinatubo in the Phillipines in June, 1991 (Rosenthal and Robert, 1993, also see: https://earthobservatory.nasa.gov/features/Volcano). The eruption sent a large amount of sulfur dioxide into the Earth’s stratosphere, reduced the amount of the Sun’s energy that reached the surface and temporarily cooling the planet.
Summary
Fieldwork and planting complications in Illinois arose this year from a prolonged period of cool and cloudy weather with very frequent but small precipitation events. The period between late March and early May this year was not record breaking in any way but had the right ingredients at the right time to significantly delay important spring work for farmers across Illinois much of the Midwest. Although a small fraction of the state has been much wetter than normal this spring so far, many places measured precipitation on two-thirds of days between late March and early May. This kept the topsoil wet to excessively wet, which was exacerbated by well below average evaporation driven by cool weather and very little sunshine.
The silver lining to this year’s confounding spring weather is that few-if-any places in the state were as wet as they were in 2019. The spring of 2019 had similar frequency of precipitation events, but with much higher totals. Instead of a tenth of an inch rain every day or two this year, many places were getting a quarter to a half inch every other day in 2019, resulting in widespread and excessively wet soils and flooding. The lack of excessively heavy rain this spring has not only reduced the risk of flooding for many, but also has meant that fieldwork can commence without much delay now that we have moved into a warmer and drier pattern.
References
Braun, Karen. "U.S. corn planting slowest since 2013, yield risks still premature" Reuters, April 2022, https://www.reuters.com/markets/commodities/us-corn-planting-slowest-since-2013-yield-risks-still-premature-2022-04-26/.
Rosenthal, A.L., and J.M. Robert, 1993, Effects of the Mount Pinatubo Eruption on Solar Insolation: Four Case Studies. New Mexico State University Southwest Technology Development Institute, https://www.osti.gov/servlets/purl/10176846.
Disclaimer: We request all readers, electronic media and others follow our citation guidelines when re-posting articles from farmdoc daily. Guidelines are available here. The farmdoc daily website falls under University of Illinois copyright and intellectual property rights. For a detailed statement, please see the University of Illinois Copyright Information and Policies here.