


Low Mississippi River Barge Disruptions: Effects on Grain Barge Movement, Basis, and Fertilizer Prices
A multi-year drought beginning in late-summer 2020 has led to record low levels in the Mississippi Basin. The Mississippi River stage in Memphis, Tennessee, fell to a record of –10.79 feet on Oct 17[2], below the previous low set in July 1988. As river levels fall, barge operators must reduce the draft, and thus the load of each barge. In addition, as the channels narrow, operators must also reduce the size of the tow (the number of barges lashed together). One way channel operation or even a full river closure also further reduce the effective capacity of the river system, slowing the number of turns a barge can make and limiting the volume it can carry. This of course increases the cost of transportation down the Mississippi River System. The purpose of this article is to identify the economic effects of the low Mississippi River disruption on farmer output and input prices, with particular examination of the dynamics in basis and Gulf vs inland price differences.
 Source: Authors’ calculations using data from USDA-AMS
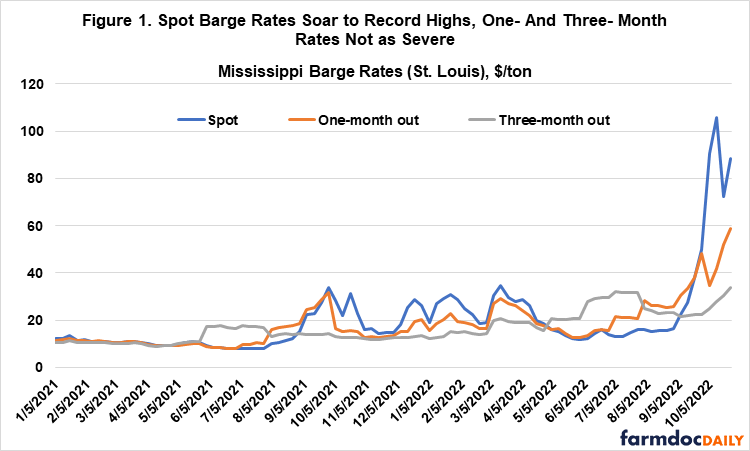
Historically barge rates have hovered around $20 per a ton. In the beginning of September, as the Mississippi River began to fall to record low levels and closures and disruptions started to mount, barge rates rapidly began increasing upwards. The St. Louis barge spot rate hit a record $106 per ton during the week of Oct 11. This spot rate had eased slightly during the second week of October, however picked up once again during the most recent week of Oct 25 rising to $88 per ton. Forward rates for barges have also picked up, but not as high as the spot rates, meaning some of the traders that locked in forwarded contracts leading up the river closures may have been partially shielded from the surging spot rates. Currently the 1 month contract at St. Louis is $59 per ton whereas the 3 month is at $34 per ton—while these rates are much higher than previous years, they are also much lower than the current spot rates suggesting there may be some expectation that spot rates may ease over the upcoming months.
Number of Grain Barges and Tonnage Movement Down in September and October
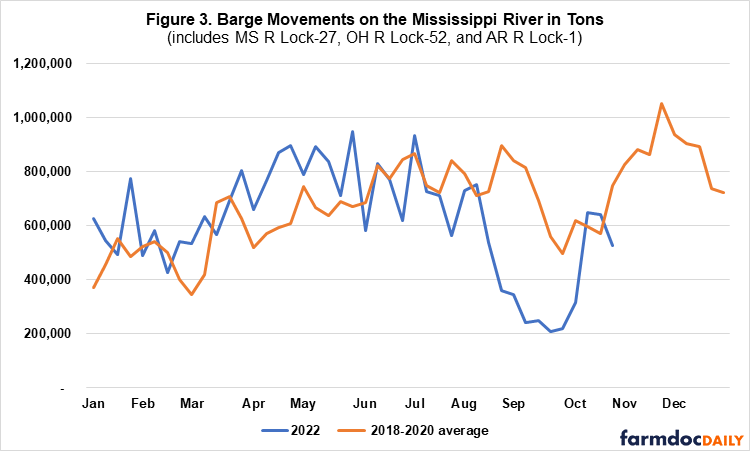
Grain barge movements are very volatile and it is difficult to assess the impacts of the low Mississippi issues. In USDA-AMS barge movement data we observe that the number of grain barges being unloaded in New Orleans through September and October were down significantly, approximately 20-30 percent lower than recent years. The slowdown during this period coincides with river closures (McWhirter, 2022) and restrictions on barge companies that reduced the bar tow, normally 30-40 barges to 25 (Kennedy, 2022). Tonnage movement has been even weaker. Since the beginning of September, tonnage going through Mississippi Lock-27, Ohio Lock-52, and Arkansas Lock-1 were down significantly, more than 40 percent lower than recent years. The more significant decline observed in tonnage would be consistent with reports of how barges have been forced to reduce draft. Typically, barges are loaded to a 11-12 foot draft during the fall, but companies started imposing 9-foot barge draft restrictions in October, which can lead to a reduction of 10,000-15,000 bushels per barge (Wicks, 2022).
Tonnage appears to have picked up in early October following reports of river reopening and easing of backlogs (Cavaliere, 2022), but the most recent report (week of October 22, 2022), slowed down again relative to the three year average. We note that it is not easy to identify the impacts of the low Mississippi river issues on grain barge movements. For instance, while we do see a significant slowdown in September, the slowing pace started declining back in August prior to the surge in barge rates. There could be other factors leading to the lower barge movement, such as grain supply and demand conditions. In later sections of this article, we will focus more of our analysis on basis effects to identify the impact of the disruptions.
 Source: Authors’ calculations using data from USDA. Note 2021 not included due to Hurricane Ida disruption.
 Source: Authors’ calculations using data from USDA. Note 2021 not included due to Hurricane Ida disruption. USDA-AMS barge movement data is based on U.S. Army Core of Engineers information. The U.S. Army Corps of Engineers has recently migrated its lock and vessel database and has noted the latest data may be revised in coming weeks.
 Source: Authors’ calculations using data from USDA
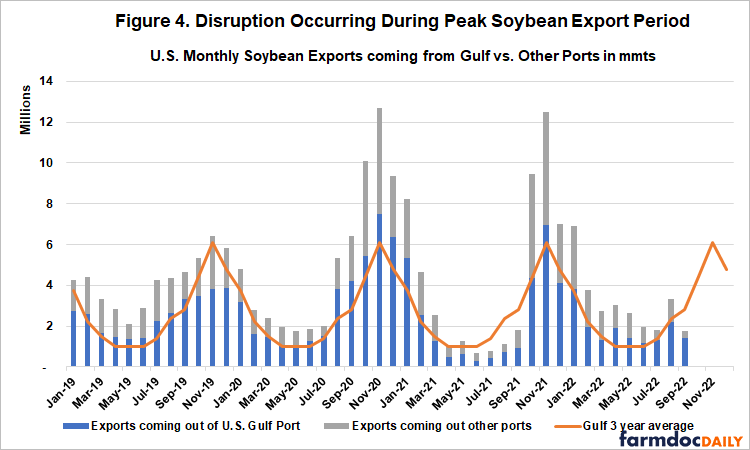
The barge disruptions come at a particularly bad time for U.S. soybeans. We are currently in the key seasonal period to export soybeans (60% of our exports occurs during the October-January window). The vast majority of U.S. soybean exports get shipped out through the Gulf port, 94% of which rely on the Mississippi River barge system to get to Louisiana (Munch, 2022). Alternative transportation options down the Gulf, such as rail, are constrained and come at a higher cost.
Latest grain export inspection data shows a general slowdown in the recent pace of grain exports. Soybean exports were particularly slow in the month of September. Exports picked up in October, but were still generally down relative to the three year average. Notably gulf exports have been down in recent weeks while exports from non-Gulf ports have been up significantly. We note that U.S. grain exports face multiple headwinds that include both a strong dollar and tighter domestic supplies. For instance, the latest October WASDE cut soybean, corn, and wheat exports (USDA-OCE, 2022). The barge issue is not the main factor behind the weaker export outlook; however, it will amplify the challenges if the low Mississippi River problems do not improve.
Impacts on Basis—Extreme Divergence Between Gulf and Interior Cash Prices
For farmers, a key concern of the low Mississippi River issues is the impact it is having on the basis—the difference between the price paid to producers in a local market and the price of nearby futures contracts listed at the Chicago Board of Trade (CBOT). A transportation disruption such as the one we are experiencing now will weaken the basis if it increases shipment cost (either through higher barge rates or forcing local elevators to use alternative costlier shipment options), leading purchasers to reduce their cash market bids.
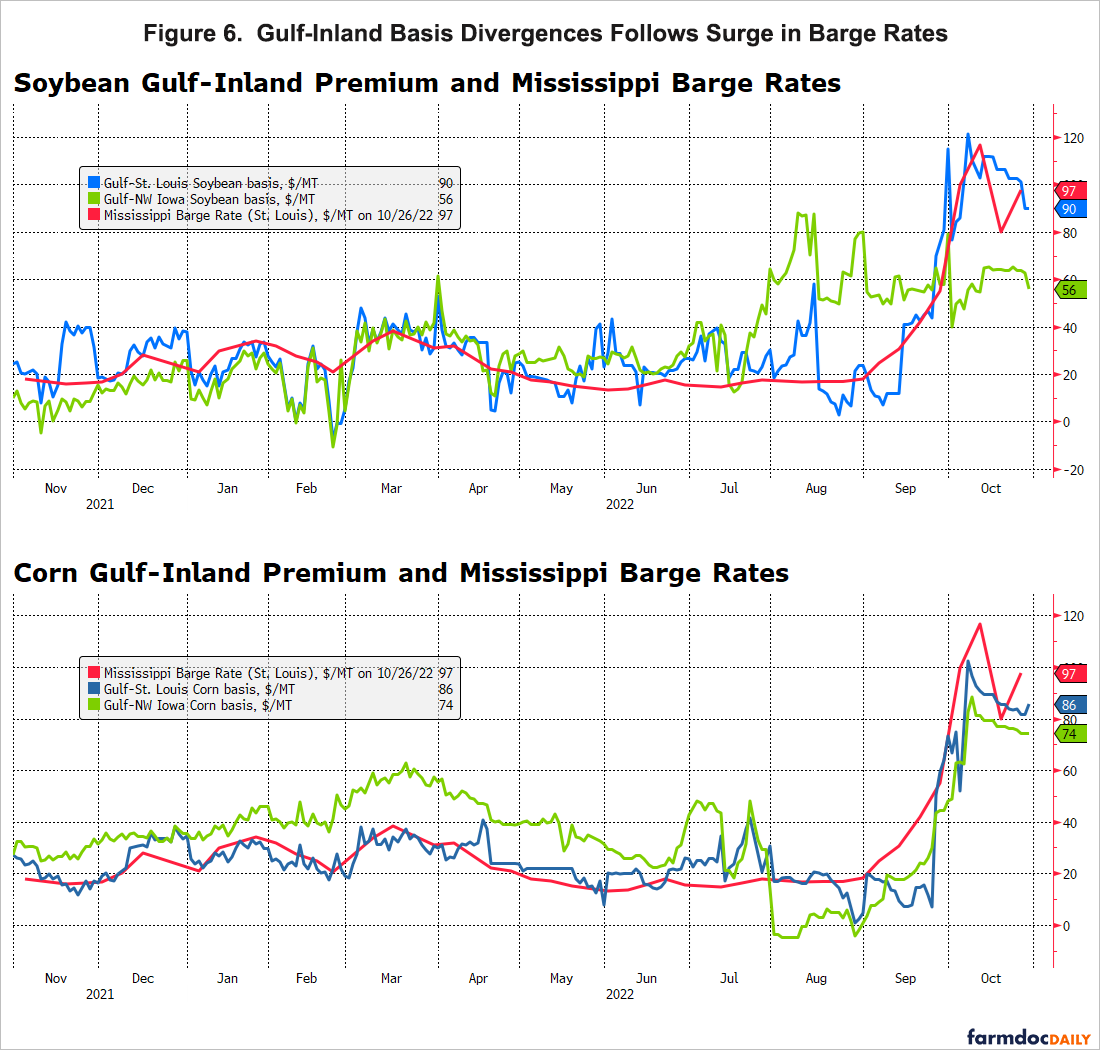
 Source: Authors’ calculations using data from Bloomberg
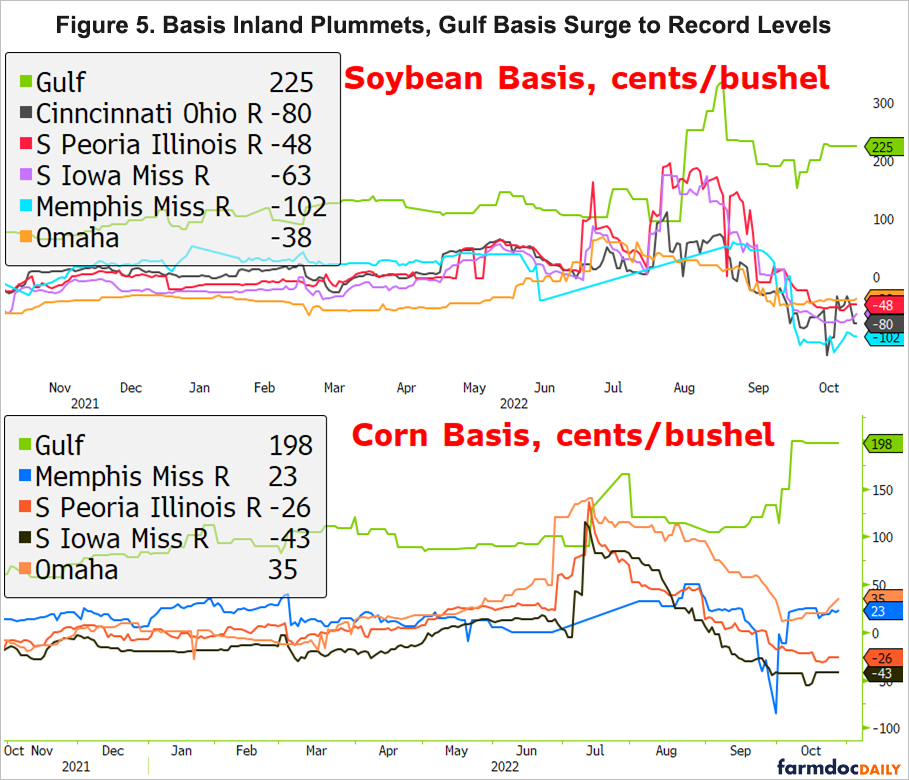
Typically, at this time of year, inland soybean cash prices along the river carry a basis of -20 cents per bushel. The Gulf always carries a premium relative to Chicago given its export location; historically the Gulf basis hovers around +60 cents per bushel at this time of year. The basis in the Gulf and interior markets were both elevated through the summer, likely due to expected strong export demand. Since August, soybean basis in the interior markets sharply deteriorated. Basis typically falls as we approach harvest (historically about 30-40 cents per bushel from August to end of September); however, this decline was much sharper than usual—a swing of approximately $2 per bushel in interior basis and coinciding with the disruption along the river and surging barge rates. In contrast the soybean basis in the Gulf remained strong and surged further reaching a record $3 per bushel, subsiding more recently to $2.25 per bushel. The Mississippi River issues have led to an extreme divergence between the Gulf and the inland basis along the river, ($3 per bushel), a reflection of the high cost of getting grain down the river and the strong premium to be had at the Gulf.
The impact on corn basis has been similar but less severe than soybeans. Corn is relatively less dependent upon exports (16% of U.S. production exported vs 43% for soybeans). Relative to corn, there is more marketing opportunities for ethanol and feed that are not available to soybeans. Further, while soybeans are heading towards the peak shipment season, this is generally the low point of the year of corn shipments out of the Gulf. Nevertheless, we are still seeing extreme divergence between the corn basis and inland markets. Corn basis in the Gulf reached almost $2 per bushel, the highest basis since 2000. Currently the difference between Gulf and inland basis is $2 per bushel.
 Source: Authors’ calculations using data from Bloomberg and USDA
In theory, changes in the spatial variation in basis reflect localized disturbances, whereby a transportation shock affecting one region should directly transmit to a widening basis proportionally to the size of the cost (e.g. barge rate). However, there may be incomplete pass through from the higher transportation costs if there are alternative options of transportation. When we line up the recent trends in barge rates, we find that the surges directly corresponds to the widening level of Gulf vs inland basis. For soybeans and corn, we can see that the difference in the basis between the gulf and at St. Louis was approximately $20 per mt prior to the low Mississippi issue—roughly the same level as St. Louis barge rate. In fact, we can see that the Gulf-St. Louis soybean & corn spread moves lock step with the Mississippi Barge rate at St. Louis. In September, following the river closures we see that the magnitude of the Gulf-St. Louis spread tracks the St. Louis barge rate almost exactly. Currently both the soybean and corn Gulf-St. Louis basis spread is at approximately $90/MT, almost exactly the current barge rate, indicating roughly a 100% pass through in barge rate prices. We observe that for markets further away from the Mississippi river, the Gulf premium is less related to the barge rate movements. For instance, the gulf premium relative to Northwest Iowa was relatively stable through September, reflecting this region’s weaker dependence upon the Mississippi distribution channel.
 Source: Authors’ calculations using data from Geograin
We may observe from the basis maps above that the Gulf to Inland price differences are quite stark compared to last October, where all inland markets have prices much weaker this year. The 2022 maps show Gulf to Inland price differences are particularly weak along the Mississippi river, with cash prices in the lower Mississippi river area being quoted at a $3 per bushel discount relative to Gulf for soybeans and $2.50 per bushel discount for corn. Areas along the upper Mississippi river are also selling at steep discount, but slightly less severe than in the lower portions. In contrast, Gulf to Inland price differences tends to be less severe in Central and Western Iowa as well as Northern Illinois, likely due to the lower influence of the river on basis and the availability of more domestic crushing facilities, ethanol plants, and feed mills. Market signals from the considerable discount to the Gulf suggests that rail and trucking options come at severely costlier level if not cost prohibitive.
The last time we experience a similar level of weakened basis was during the U.S. China Trade war (Adjemian et al. 2019). Retaliatory tariffs imposed during the summer of 2018 by China on broad range of agricultural commodities, including a 25% duty on soybeans, had led to collapse of export demand. Similar to what we are experiencing now, there was a severe deterioration in soybean basis, however back then the PNW region was much more affected. What is different this time around is that the basis weakening is concentrated along the Mississippi river, and additionally there has been a notable surge in the Gulf basis. The basis divergence with the Gulf clearly softens the further away we get from the Mississippi. As we can see above, the basis is holding up better in the Dakotas, which has better access to the Pacific Northwest export routes. Inland areas of Kansas and Nebraska are faring better along with Eastern production areas of the United States that do not rely upon the Mississippi river.
Higher Input Prices Upriver
The Mississippi river issues is also leading to challenges for fertilizers and other inputs that are shipped up river from the Gulf. Right now is not necessarily a pivotal time for fertilizer imports from the Gulf. Most nitrogen fertilizer is imported through the spring and vast majority of potash gets railed in from Canada; however a significant portion of imported DAP & MAP fertilizer is needed through the fall. Approximately 25-40% of U.S. consumption of DAP & MAP moves through the Mississippi; about a third of urea consumption. Similar to grains, we have seen an emerging disconnect in prices interior and the Gulf, with higher prices upriver relative to down river. While DAP prices quoted out of the Gulf have fallen $30-$40 per mt since September, price upriver have increased $10-$30 per mt. Urea Gulf prices have fallen by about $100 per mts, whereas prices up river have fallen by only half that. This widening price premium suggest farmers may be paying $50 more per mt than what they would have been paying before the barge disruption issue. We note the amount is similar in magnitude to the size of the widening Gulf premium for soybeans and corn.
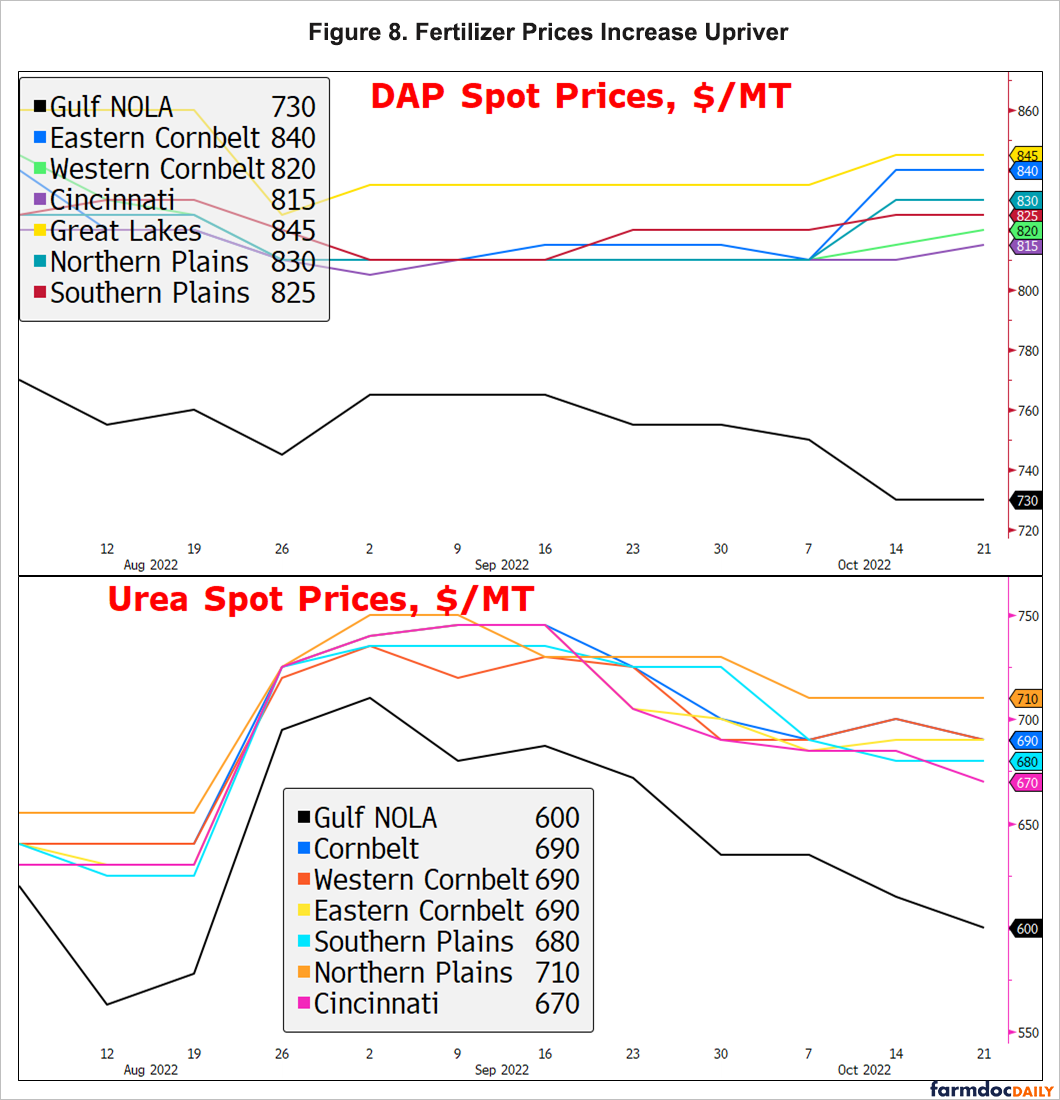 Source: Authors’ calculations using data from Green Markets
Lord Willing and the Creek Don’t Rise
When will the situation normalize? We would expect the disruption to ease as rains start filling the depleted river. It is not clear when this might occur, but we do we think it is helpful to be mindful of the seasonality of the river’s stages.
 Source: U.S. Drought Monitor
Record-Low Mississippi River Stages Set in October 2022
| Gauge Location | 2022 Minimum Stage | Previous Record and Date |
| New Madrid, Missouri | -5.51 feet on October 15 | -5.32 feet on August 30, 2012 |
| Caruthersville, Missouri | -1.82 feet on October 16 | -0.82 foot on August 30, 2012 |
| Osceola, Arkansas | -11.66 feet on October 17 | -10.30 feet on July 11, 1988 |
| Memphis, Tennessee | -10.79 feet on October 17 | -10.70 feet on July 10, 1988 |
| Greenville, Mississippi | +5.26 feet on October 24 | +6.70 feet on January 4, 1964 |
October is the seasonal low of the Mississippi and this year it has reached record lows. The Mississippi River stage at Memphis, Tennessee, has fallen to -5.00 feet or below in 23 individual years since 1954 – about once per 3 years. Some of those low levels have occurred in “couplets,” with drought in the autumn of first year being followed by drought- and ice-lowered levels early in the second year.
According to seasonal patterns, the Mississippi rises through the winter and then picks up significantly with spring rain and snowmelt. Historically, river flows are often lowest in autumn, but those minima can be pushed into the winter if 1) drought persists and 2) cold weather locks up water in the upper part of the basin due to ice formation. However, in the absolute worst-case scenario, the river will most certainly have to rise by March. An annual minimum level below -5.00 feet at Memphis has never occurred after February 7; the low for 1977 occurred on that date with a stage of -6.00 feet. So, while we are all hoping to receive sufficient rain much before then, at the very least, there is a backstop (no later than March 2023) to this worst-case scenario. However, this may provide little comfort to farmers, particularly soybean producers, as Spring will be the time Brazil starts ramping up its soybean exports; further, even when the rivers rise, the backlog in shipping may take some time to unwind.
 Source: Authors’ calculations using data from the United States Geological Survey
Month of Mississippi River Low-Water Stages Below -5.0 Feet in Memphis
| July | 1988 |
| August | 2005, 2006 |
| September | 1976, 2002, 2012 |
| October | 1991, 1999, 2007, 2013, 2015, 2017, 2022 |
| November | 1987 |
| December | 1980, 2008 |
| January | 1956, 1964, 1981, 2000, 2001 |
| February | 1977, 2003 |
Summary
The record low Mississippi river has led to a severe disruption in the barge transportation system vital for the shipment of grains and farm inputs. Barge rates have become extremely elevated. The number of grain barges and tonnage movement sent down to the Gulf have been lower in September and October. We continue to observe an extreme divergence between the Gulf and regions along the river, with Gulf premiums fetching record premiums of $3 per bushel for soybeans and $2.50 per bushel for corn or $50 per MT. This rise in Gulf premiums (or deteriorating inland prices) follows very closely the surge in barge rates, with almost complete pass-through from some of the observed higher rates to widening Gulf-Inland spreads. Soybean basis in the Low Mississippi region has deteriorated the most severely, followed by the Upper Mississippi; basis changes ease moving away from the river. Imported inputs, such as DAP, MAP, and urea fertilizers have also become more costly, selling at an additional premium relative to Gulf upwards of $50 per metric ton. Farmers, particularly those within the draw of Mississippi River, are likely to continue to face lower grain cash prices and higher fertilizer prices in the near term that would be expected to be eased by no later than early Spring.
Notes
[1] The findings and conclusions in this article are those of the authors and do not represent the U.S. Department of Agriculture. [2] a zero datum value for a river gauge is not necessarily referenced to the depth of the riverbed, and is often referenced to another recognized datum.References
Adjemian, M. K., Arita, S., Breneman, V., Johansson, R., & Williams, R. (2019). Tariff Retaliation Weakened the US Soybean Basis. Choices, 34(4), 1-9.
Cavaliere, V. “Huge Barge Backup Eases on Mississippi, Freeing Tons of Cargo” Bloomberg. Oct 9, 2022. Available at https://www.bloomberg.com/news/articles/2022-10-09/huge-barge-backup-eases-on-mississippi-freeing-tons-of-cargo?leadSource=uverify%20wall
Chipman, K., and A. Quinn. “Soybeans Sag as the Dollar’s Strength Dims US Export Outlook” Bloomberg. Oct 24, 2022. Available at https://news.bloombergtax.com/international-trade/wheat-swings-as-trade-weighs-outlook-for-ukraine-export-corridor
Kennedy, M. “Mississippi River Barge Movements Restricted Due to Critical Low Water Levels”. DTN Progressive Farmer. Oct 3, 2022. Available at: https://www.dtnpf.com/agriculture/web/ag/blogs/market-matters-blog/blog-post/2022/10/03/mississippi-river-barge-movements
McWhirter, C. “Drying Mississippi River Threatens U.S. Supply Chain”. Wall Street Journal. Oct. 14, 2022. Available at https://www.wsj.com/articles/mississippi-river-approaching-record-low-water-levels-threatening-commercial-traffic-11665748981?mg=prod/com-wsj
Munch, Daniel. “Low Mississippi River Water Levels Threaten Grain Shipments, Spur Record Rates” Farm Bureau Market Intel, Oct 13, 2022. Available at: https://www.fb.org/market-intel/low-mississippi-river-water-levels-threaten-grain-shipments-spur-record-rat
United States Department of Agriculture-Agricultural Marketing Service. Grain Transportation Report. Oct 27, 2022. Available at: https://www.ams.usda.gov/sites/default/files/media/GTR10272022.pdf
United States Department of Agriculture-Office of the Chief Economist. World Agricultural Supply and Demand Estimates. Oct 12, 2022. Available at: https://www.usda.gov/oce/commodity/wasde/wasde1022.pdf
Wick, N. “River levels challenging grain shippers, shifting trade.” Oct 26, 2022. Available at: https://www.agri-pulse.com/articles/18423-low-mississippi-river-water-levels-continue-to-challenge-grain-shippers?utm_source=Instant+Update&utm_campaign=4867092524-EMAIL_CAMPAIGN_2017_02_23_COPY_4024&utm_medium=email&utm_term=0_288ff2b53a-4867092524-49754652
Disclaimer: We request all readers, electronic media and others follow our citation guidelines when re-posting articles from farmdoc daily. Guidelines are available here. The farmdoc daily website falls under University of Illinois copyright and intellectual property rights. For a detailed statement, please see the University of Illinois Copyright Information and Policies here.