An Estimate of Farmland Acreage Change from Plant-Based Food
Abstract
This article estimates the amount of farmland used to grow feed to raise a steer, hog, and broiler, and it compares the land use associated with beef, pork, chicken, plant-based meat, and other soy food products. These calculations find that switching to plant-based meat does not necessarily lead to lower acreage use.
Introduction
The emerging plant-based meat industry has the potential to change farmland allocation in U.S. agriculture. Plant-based meat companies such as Impossible Burger aim to capture market from the livestock industry, not only for profits but also to reduce greenhouse gas emissions and natural resource use. Farmland is one natural resource that plant-based meat purports to save, if consumers substitute regular meat for plant-based meat. In response to this market capture, livestock farmers would cut herd sizes, reducing demand for livestock feed, which would reduce demand for crops used for livestock feed such as corn and soybean. But exactly how much farmland could be freed up by a switch to plant-based meat? This article estimates farmland use associated with beef, pork, poultry, and soy food production, and it finds that pound-for-pound beef takes 14.2 times more farmland to produce than plant-based meat; pork takes 1.7 times more farmland; chicken takes slightly less farmland than plant-based meat; and plant-based meat is the most land-efficient way to deliver soy protein compared with other soy foods.
Arable land is a scarce resource, but environmental and economic analysts disagree about the urgency of the depletion of this resource. In the U.S., some believe that the rate of commercial development threatens the availability of farmland to grow enough food. According to the American Farmland Trust, for example, the U.S. lost on average 730,000 acres of farmland per year between 2000-2016, and American farms are increasingly at risk of being sold to developers as the average age of American farmers increases and they die out. Additionally, the amount of arable land per capita is shrinking as the global population grows (FAO 2021), and China, the world’s fastest growing consumer of food, requires an additional 8 million more acres of farmland each year to meet its growing food demand (Zulauf 2022). Meanwhile, others argue that the “threat to America’s agricultural land base from development remains long-term and speculative rather than urgent” due to gains in crop yields and under-utilized prime farmland, and the issue is not so much the availability of farmland, but soil erosion which reduces farmland’s ability to grow food (Gottlieb 2015).
The majority of the land used by the livestock industry is for livestock feed production. According to the USDA National Agricultural Statistics Service, farmland in the U.S. totaled 895.3 million acres in 2021. 93.4 million of those acres were used to grow corn, 37% of which was used for livestock feed, and another 35% went toward ethanol production (USDA Feed Grains Database), 30% of which was turned into distillers grain, another component of livestock feed (Kub 2014). In 2021 the U.S. also planted 87.2 million acres of soybeans, 77% of which was turned into soybean meal for livestock feed (USDA Feed Grains Database). Another 119 million acres of U.S. farmland is pastureland, used for grazing cattle (USDA Natural Resource Conservation Service).
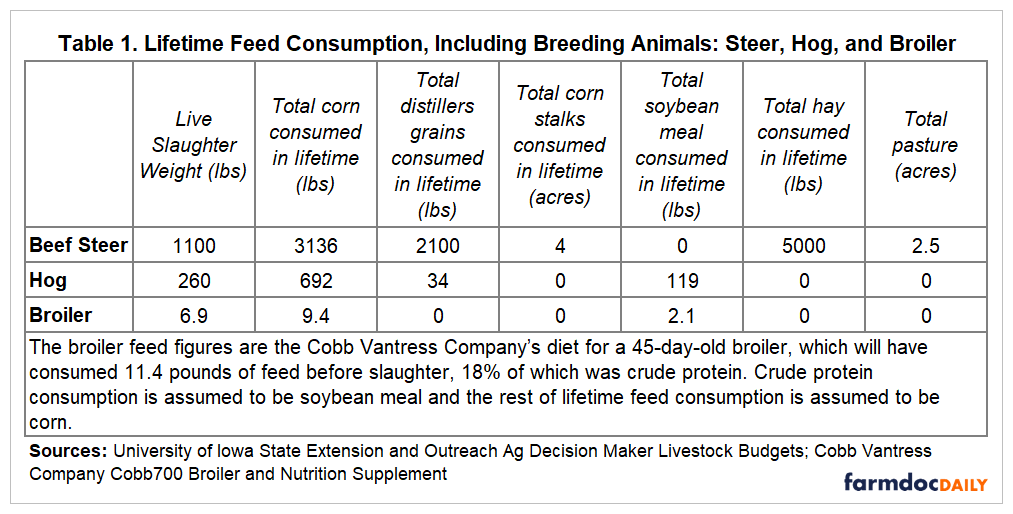
Land use associated with beef, pork, and poultry production can be calculated by converting lifetime feed consumption of a steer, hog, and broiler into farmland acreage. Table 1 lists lifetime feed consumption for one beef steer (slaughtered at 1100 pounds), one hog (slaughtered at 260 pounds), and one broiler chicken (slaughtered at 6.9 pounds). These volumes are estimated using Iowa State University’s livestock budgets and Cobb Vantress Company’s broiler feed schedule. For steer and hog feed consumption, breeding animals’ feed consumption is included in the total. For broiler feed consumption, the breeding hen’s feed consumption is not included in the total because a hen lays hundreds of eggs in a lifetime and the feed it consumes to lay just one egg is insignificant.
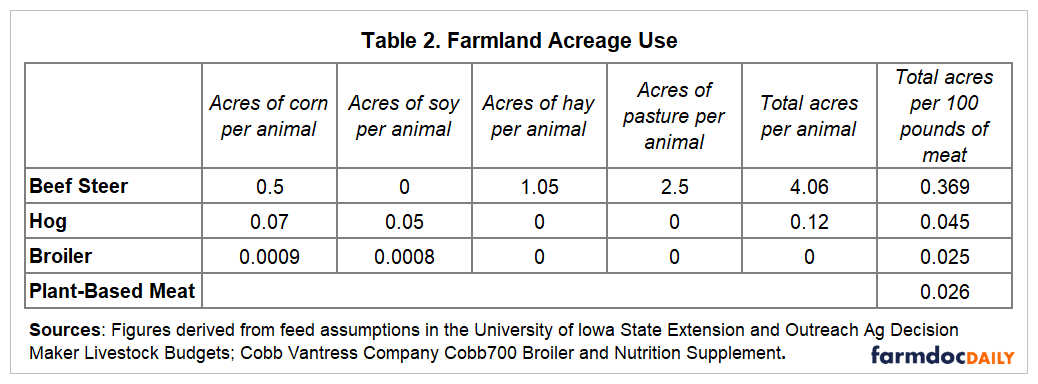
Table 2 lists farmland use per animal and per hundred pounds of meat product. Per animal farmland use is calculated by dividing the animal’s lifetime feed consumption by crop yields. These calculations use the ten-year average of corn and soybean yields for Iowa, and the 2021 national average for hay yield: 185.2 bushels/acre for corn, 54.2 bushels/acre for soybeans (Iowa State University Extension), and 2.37 tons/acre for hay (USDA Feedgrains Yearbook Tables). The calculations assume corn volume as 56 pounds/bushel and soybean meal volume as 47.5 pounds/bushel (Soya Grains Alliance). The land use figure for 100 pounds of meat is calculated by dividing an animal’s land use by its slaughter weight and multiplying that figure by 100. Plant-based meat land use is calculated using a land use figure (2.4 square meters per kilogram) from a life cycle analysis commissioned by Impossible Foods (Khan 2019). It is assumed that all of that land is from soybean cropping, since soy protein concentrate is the primary ingredient in the Impossible Burger.
The data in Table 2 makes possible a comparison of total land use between animal meat and plant-based meat, per pound of product. This study’s calculations find that it takes 14.2 times more farmland to produce 1 pound of beef than 1 pound of plant-based meat, and 1.7 times more farmland to produce 1 pound of pork than 1 pound of plant-based meat. However, a pound-for-pound land use comparison between chicken and plant-based meat finds that it takes slightly less land to produce a pound of chicken than a pound of plant-based meat: 1 pound of chicken uses 96% percent of the land needed to produce 1 pound of plant-based meat.
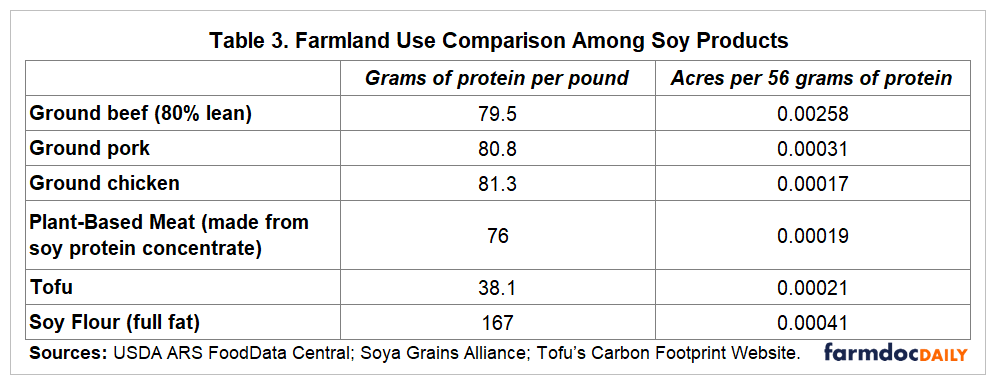
Another angle to consider when thinking about land-use efficiency and protein production is how plant-based meat compares with other soy food products. Table 3 compares the farmland acreage used to produce 56 grams of protein, the daily value recommended for an adult man, from various meat and soy products. Interestingly, plant-based meat actually is a more efficient way to deliver protein than tofu, another product commonly used as a meat substitute; it takes nearly twice the amount of land for tofu to deliver the same amount of protein as plant-based meat. It should be noted that a different soybean variety is used to grow soy used to make products edible to humans. These varieties tend to have lower yields (University of Kentucky Cooperative Extension Service, 2013). Since this analysis uses a soybean yield from the varieties grown for livestock feed, the calculations likely overestimate the acreage change that would occur from a switch to plant-based meat.
Implications of Less Land Use
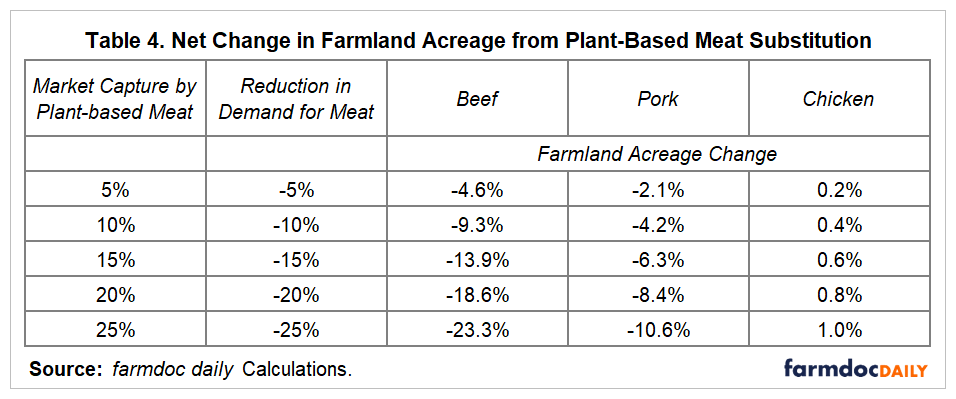
What do these differences in land use mean for cropping changes if plant-based meat captured market from the livestock industry? Table 4 displays net reduction in farmland use by the beef, pork, and chicken industries if plant-based meat captured varying shares of their markets. These calculations find that a 25% market capture by plant-based meat of the beef market would result in a 23.3% net reduction in farmland used for the production of “beef,” both real and plant-based; 25% market capture of the pork market would result in a 10.6% net reduction in farmland used for the production of “pork,” both real and plant-based; and a 25% capture of the poultry market would actually involve a 1.0% increase in farmland acreage needed to produce “chicken,” both real and plant-based.
These calculations indicate that a market shift away from beef and pork and towards plant-based meat would reduce the amount of farmland needed to grow livestock feed, but replacing poultry with plant-based meat would actually increase land use.
Data Sources
Iowa State University Extension and Outreach. 2021. Ag Decision Maker Farrow-to-Finish Costs and Returns.
Iowa State University Extension and Outreach. 2021. Ag Decision Maker Beef Cow-Calf Costs and Returns.
Conversion Table – Specialty Soya and Grains Alliance (soyagrainsalliance.org)
USDA ERS Feed Grains Database
USDA ERS Oil Crops Data: Yearbook Tables
USDA Pasture Resources | Natural Resources Conservation Service (usda.gov)
USDA National Agricultural Statistics Service: Farms and Land in Farms 2021 Summary 02/18/2022 (usda.gov)
References
American Farmland Trust. What's at Stake - American Farmland Trust
Cobb-Vantress Company. “Cobb700 Broiler: Performance and Nutrition Supplement.”
FAO. 2021. “The State of the World’s Land and Water Resources for Food and Agriculture.” https://www.fao.org/3/cb7654en/cb7654en.pdf
The Good Food Institute. 2019. “Plant-Based Meat for a Growing World.” GFI-Plant-Based-Meat-Fact-Sheet_Environmental-Comparison.pdf
Gottlieb, P. D. 2015. “Is America Running Out of Farmland?”. Choices. Quarter 3. http://choicesmagazine.org/choices-magazine/submitted-articles/is-america-running-out-of-farmland
Khan, S., Dettling, J., Loyola, C., Hester, J. & Moses, R. Environmental Life Cycle Analysis: Impossible Burger 2.0. Impossible_foods_comparative_LCA.pdf (ctfassets.net)
Kub, Elaine. 2014. “Master the Grain Markets: How Profits are Really Made.” Kub Asset Advisory, Inc.: Omaha, Nebraska.
Lusk, Jayson, Blaustein-Rejto, Daniel, Shah, Saloni, & Tonsor, Glynn. 2021. “Impact of Plant-Based Meat Alternatives on Cattle Inventories and Greenhouse Gas Emissions.” Impact of Plant-Based Meat Alternatives on Cattle Inventories and Greenhouse Gas Emissions by Jayson Lusk, Daniel Blaustein-Rejto, Saloni Shah, Glynn T. Tonsor :: SSRN
McConnell, Michael. 2021. “U.S. Feed Grains Sector at a Glance.” USDA Economic Research Service. USDA ERS - Feedgrains Sector at a Glance
Tofu’s Carbon Footprint. “About the Carbon Calculations.”
University of Kentucky Cooperative Extension Service. 2013. “Specialty Soybeans.” Center for Crop Diversification, University of Kentucky.
Zulauf, C. 2022. "China and the World’s Increasing Need for Cropland." farmdoc daily (12):192, Department of Agricultural and Consumer Economics, University of Illinois at Urbana-Champaign, December 19, 2022.
Disclaimer: We request all readers, electronic media and others follow our citation guidelines when re-posting articles from farmdoc daily. Guidelines are available here. The farmdoc daily website falls under University of Illinois copyright and intellectual property rights. For a detailed statement, please see the University of Illinois Copyright Information and Policies here.


