Comparing Fixed Cash, Variable Cash, and Share Rents for 2024
Recent crop budget and return projections for the 2023 and 2024 crop years show the potential for much lower, and potentially negative, returns to corn and soybeans across Illinois (farmdoc daily August 29, 2023). Lower corn and soybean prices in 2023 and 2024 lead to lower returns than in 2020 to 2022, despite some declines in fertilizer costs. Production costs remain high (farmdoc daily September 26, 2023), such that break-even prices are near $5.00 per bushel for corn and $12.00 per bushel for soybeans for 2024, assuming trend yields.
Reducing land costs, specifically rental rates, often are needed during periods of lower returns. Fixed cash rent leases, where the farmer pays the landowner a fixed rental rate, can be difficult to re-negotiate to lower levels. Traditional share rent leases provide natural risk sharing between the farmer tenant and landlord but require more intensive management by the landlord and more coordination between both parties. The variable cash lease has been suggested as a sort of middle-ground approach that provides risk-sharing benefits while also minimizing the management requirements for the landlord (farmdoc daily August 10, 2021; September 20, 2022; and January 21, 2023).
Today’s article provides a historical comparison of the fixed cash, variable cash, and share lease designs. The variable cash lease adjusts to fluctuating revenue levels; however, the traditional share lease is more highly correlated with returns since it incorporates both revenues and direct costs in rental determination. Projections for the 2023 and 2024 crop years are for negative farmer returns under both fixed and variable cash leases, but modest positive farmer returns under a traditional 50/50 share agreement.
Variable Cash Rent
Previous articles have provided suggestions for the design of a variable cash lease (farmdoc daily August 10, 2021; September 20, 2022; and January 21, 2023). Parameters include minimum and maximum rent levels and a rent factor. The variable cash rent level is then determined by multiplying the rent factor times a measure of crop revenue (crop yield x market price). Rent for the year is equal to the calculated rent value (rent factor x crop revenue) when it falls between the minimum and maximum rent levels. Rent is the minimum rent level when the calculated rent falls below the minimum. Rent is the maximum rent level when the calculated rent is above the maximum.
Suggested values for the minimum and maximum rent levels are $100 below and $100 above typical fixed cash rent levels for the area. The minimum rent provides a floor for the rent received by the landowner, while the maximum rent provides a ceiling on the rent the farmer tent may need to pay in any given year.
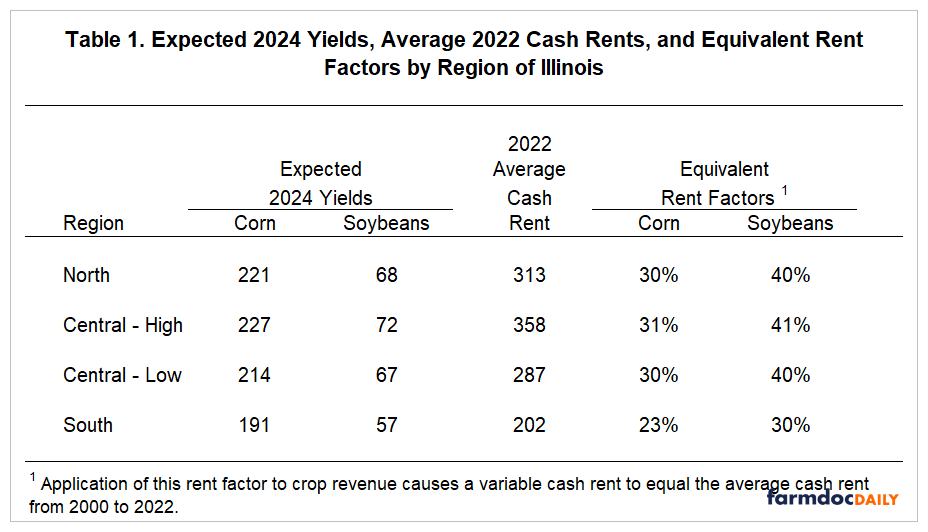
Suggested rent factors have been previously established by crop and region. Table 1 summarizes the suggested rent factors for corn and soybeans in northern, central, and southern Illinois based on average crop return data by region from 2000 to 2022. The rent factors were set to make variable cash rent levels equal to average cash rents over time.

For corn in northern and central Illinois, the suggested rent factor would be around 30%. The southern Illinois rent factor for corn would be around 23%. The suggested soybean rent factor would be around 40% in northern and central Illinois, and around 30% for southern Illinois. Regional rent factors for soybeans are higher because of lower crop revenue per acre compared with corn.
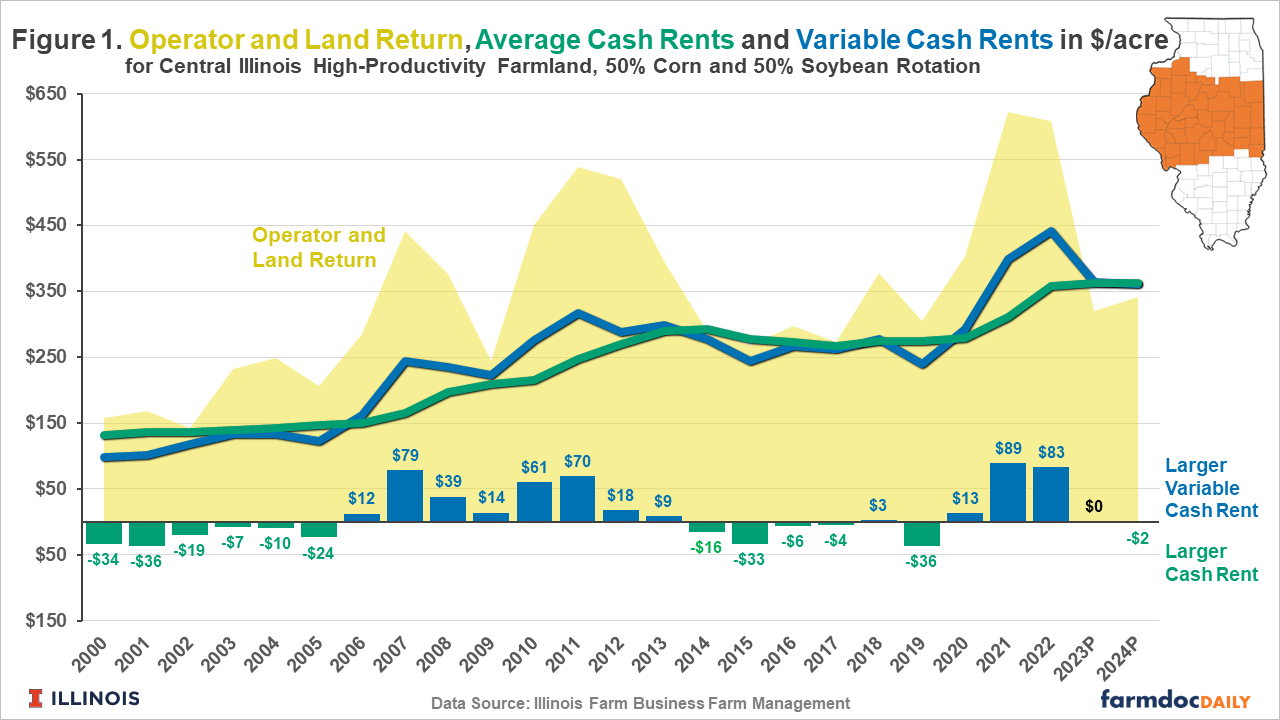
Figure 1 provides a historical comparison between average fixed cash and variable cash rent levels for high-productivity farmland in central Illinois assuming a 50/50 corn/soybean rotation. Operator and land returns are also provided in Figure 1. Variable cash rent levels tend to exceed average fixed cash rent levels during periods of higher returns, as seen by variable cash rents having higher returns than cash rents from 2006 to 2013, and more recently from 2020 to 2022. Average fixed cash rents were higher than the variable cash rent during the lower return periods of the early 2000s and from 2014 to 2019.

The average farmer return under the variable cash lease from 2000 to 2022 was $104/acre, slightly below the average farmer return of $116/acre for the fixed cash lease. This means the average rent received by the landlord would be $12/acre higher under the variable lease than the fixed cash agreement.
Current projections for the 2023 and 2024 crop years suggest similar values for variable and fixed cash rents. Negative net returns are currently projected for both 2023 and 2024 at average fixed cash rent levels, due to lower corn and soybean prices and production costs levels which remain at historically high levels despite the decline in nitrogen fertilizer prices from peak levels reached in 2022. While lower prices result in lower variable cash rent levels compared with 2021 and 2022, net return projections for 2023 and 2024 are also negative under the variable cash lease design.
Share Rent
Figure 2 provides a historical comparison of average fixed cash rent and a typical 50/50 share rent agreement for high-productivity farmland in central Illinois assuming a 50/50 corn/soybean rotation. There can be significant variation in the specific design of share rent agreements in practice. Under the 50/50 share lease, the farmer and landowner evenly split crop revenues, crop insurance proceeds, and government payments and pay equal shares of direct crop costs (seed, fertilizer, pesticides, drying storage, and crop insurance premiums).

Similar to the variable cash lease, the share rent tends to exceed the fixed cash rent in years of relatively high returns and vice versa. Farmer returns average $105/acre from 2000 to 2022 under the share lease, similar to the $104 average return for the variable lease over the same time period.
However, because the share rent incorporates both revenues and direct costs, it tends to be more responsive to return levels than the variable cash lease which is only based on crop revenues. From 2000 to 2022, share rent levels have a 0.94 correlation with operator and land returns. The correlation for variable cash rent is 0.82, and the correlation for fixed cash rent is 0.57. A result of being more responsive to returns is that the share lease will tend to exhibit the most variability in rent levels over time, which could be viewed as a disadvantage from the landowner’s perspective when comparing to the variable and fixed cash alternatives.
The responsiveness of the share lease to returns is highlighted by projections for 2023 and 2024. Modest positive returns to farm operators are projected under a share rent agreement for both years ($29/acre for 2023 and $36/acre for 2024), compared with the negative returns to farm operators projected under the fixed cash and variable cash lease agreements (-$43/acre for 2023 and -$20/acre for 2024). This of course implies that the rent received by the landowner in a share lease would be projected lower for 2023 and 2024 than in a fixed cash or variable cash lease situation.
Conclusions
Lower corn and soybean prices and elevated production costs suggest much lower, and potentially negative, farmer return levels across Illinois for the 2023 and 2024 crop years. Land rents are often a primary target for cost reductions during periods of low returns. While fixed cash rent levels can be difficult to negotiate to lower levels, share rent and variable cash rent agreements automatically adjust to changing conditions once the lease parameters have been set.
Share leases result in rents which are highly correlated with returns, resulting in a high level of risk-sharing between the tenant and landlord. However, they also require relatively intensive coordination between the farmer tenant and landlord in making management decisions.
The variable cash design can address the management complications of a share lease, while also providing some risk-sharing. However, variable cash leases typically do not incorporate any measure of production costs and thus do not capture the impact of changing production cost on farmer returns.
Budgets for 2023 and 2024 suggest a variable cash lease would result in similar rent levels to a fixed cash lease while a share rent lease would result in a lower rent paid to landlords. Projected farmer returns would be negative under the fixed and variable cash lease designs, while the share rent would suggest modestly positive farmer returns in both years.
References
Paulson, N., G. Schnitkey, C. Zulauf, J. Colussi and J. Baltz. "The Rising Costs of Corn Production in Illinois." farmdoc daily (13):175, Department of Agricultural and Consumer Economics, University of Illinois at Urbana-Champaign, September 26, 2023.
Schnitkey, G., N. Paulson, C. Zulauf and J. Baltz. "2024 Crop Budgets." farmdoc daily (13):157, Department of Agricultural and Consumer Economics, University of Illinois at Urbana-Champaign, August 29, 2023.
Schnitkey, G., C. Zulauf, N. Paulson and J. Baltz. "Variable Cash Rental Arrangements in 2023." farmdoc daily (13):16, Department of Agricultural and Consumer Economics, University of Illinois at Urbana-Champaign, January 31, 2023.
Schnitkey, G., C. Zulauf, N. Paulson, K. Swanson, J. Coppess and J. Baltz. "A Straight-Forward Variable Cash Lease with Revised Parameters." farmdoc daily (12):145, Department of Agricultural and Consumer Economics, University of Illinois at Urbana-Champaign, September 20, 2022.
Schnitkey, G., C. Zulauf, K. Swanson and N. Paulson. "A Straight-Forward Structure for a Variable Cash Rent." farmdoc daily (11):117, Department of Agricultural and Consumer Economics, University of Illinois at Urbana-Champaign, August 10, 2021.
Disclaimer: We request all readers, electronic media and others follow our citation guidelines when re-posting articles from farmdoc daily. Guidelines are available here. The farmdoc daily website falls under University of Illinois copyright and intellectual property rights. For a detailed statement, please see the University of Illinois Copyright Information and Policies here.


