Farm Policy and the Brief Saga of Soybeans, Part 2
Congress appears to be starting the New Year much as it ended the old one: barreling towards another potential government shutdown while haggling over a bill extending the continuing resolution, this time from January 19th and February 2nd to March 1st and 8th (Yilek, January 16, 2024; Emma, January 18, 2024, Foran, et al., January 18, 2024; Scholtes, Beavers, and Carney, January 18, 2024). Among many other things, each extension of the continuing resolution is likely to delay a farm bill reauthorization effort further into the spring. In the interim, this article continues the series exploring the nation’s second largest commodity crop and farm policy’s third largest program crop: soybeans (farmdoc daily, November 30, 2023). American farmers have planted soybeans for over 100 years. Congress has authorized direct assistance to farmers of some commodities for more than 90 years (since 1933 AAA), however, soybeans were added only just over 20 years ago (2002 Farm Bill). The lack of a farm program or the potential for payments did little to deter American farmers from planting the crop in increasing amounts, especially after World War II. This article reviews the adoption of soybeans across different regions of the country to add further perspective.
Background
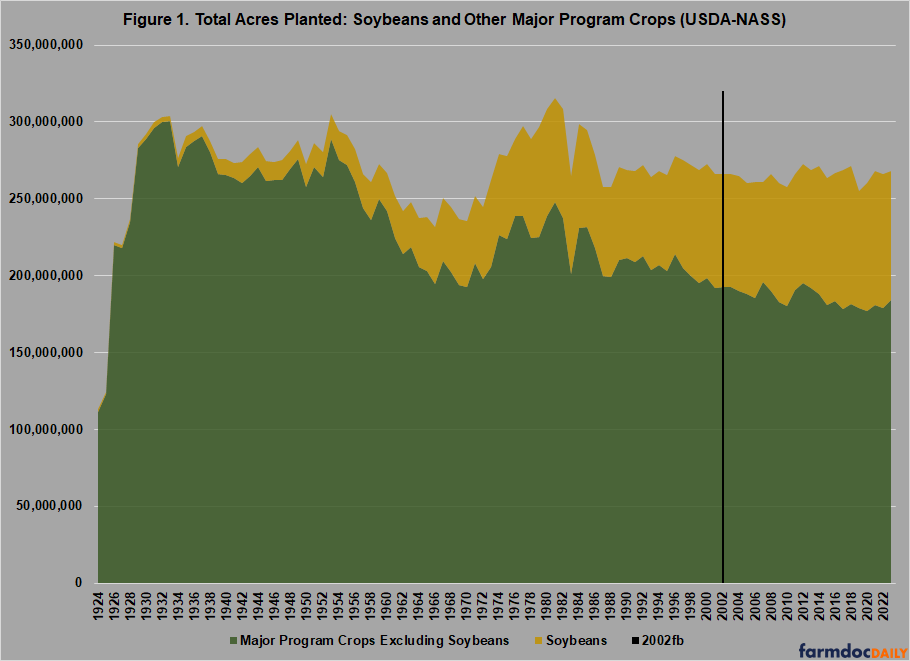
The previous article illustrated the total increase in soybean acres since 1924, rising from a little over 1.5 million acres in 1924 to a maximum of over 90 million acres in 2017 and 83.6 million acres last year. Figure 1 illustrates the acres planted to the major program crops as well as comparing soybeans to all other major program crops. For purposes of this discussion, the major program crops reviewed are as follows: corn, wheat, other feed grains (barley, oats, rye, and sorghum), soybeans, cotton, rice, and peanuts. The data in Figure 1 are from the NASS Quick Stats database (USDA-NASS, Quick Stats). A marker has been included to indicate the Farm Security and Rural Investment Act of 2002 (P.L. 107-171) which added soybeans to farm programs.
Although soybeans were not a program crop until 2002, that does not mean that farm policy had no impact on the planting of soybeans. For example, the parity system of farm policy that emerged from the Great Depression and the New Deal attempted production controls by limiting acres planted to the price supported crops, mostly through acreage allotments. In general, acreage allotments did not remove acres from production, the allotment limited plantings of the supported crops and farmers were able to plant other commercial crops on the acres above the allotment. In other words, farmers could switch acres from the supported crop subject to an allotment to other crops so long as an allotment was not in place for those other crops (see e.g., Coppess, 2018). It is possible, therefore, that the parity system of policy had some impact on the planting of soybeans as an alternative cash crop. The discussion below digs deeper into the acreage data for further indications that farm policy impacted the national soybean acreage footprint.
Discussion
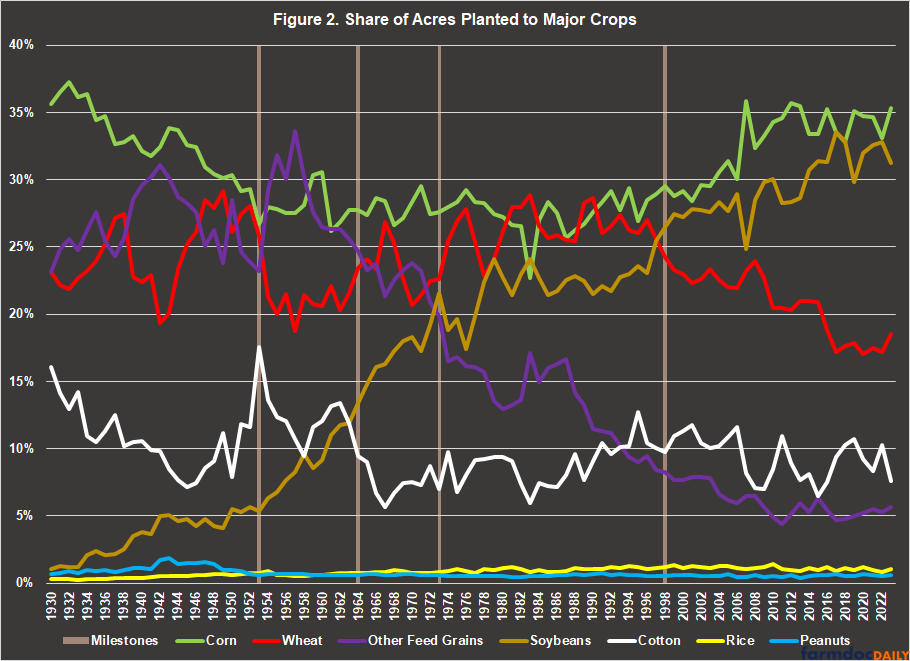
Farm policy could have impacted the soybean acreage footprint by encouraging farmers to shift acres from a supported crop under allotments and into soybeans. Figure 2 provides an initial look, charting the NASS planted acres data for each of the major program crops as a percentage of the total planted for all of the major program crops for the years 1930 to 2023. Key milestones for soybeans are also included and discussed below.
Acres planted to soybeans remained around 5% of the national total through World War II; noticeably, those acres began a significant and steady increase after 1953, coinciding with significant decreases in cotton and wheat acres. As a share of acres planted to the major crops, soybeans averaged 4.5% from 1941 to 1949, and went from just over 4% in 1949 to 5.7% in 1953 before crossing the 6% threshold in 1954. From that point on, soybean acres took off. As a share of the total planted to all major crops, soybeans topped acres planted to cotton in 1964 when soybeans exceed 13% and cotton acres fell below 10% of the national total for these crops. Soybean acres overtook the other feed grains in 1973. Finally, soybean acres overtook wheat acres in 1998.
From Figure 2 are questions about the pace of adoption of soybeans in different states and regions, as well as the impacts on the other major crops. The following is a closer look at the soybean acreage footprint, or soybean plantings as a share of the acres planted to the major program crops, using a regional grouping of states. Additional analysis could build on this at the individual State and county level. These figures provide an initial look, a sample or preview for a potentially more-thorough analysis.
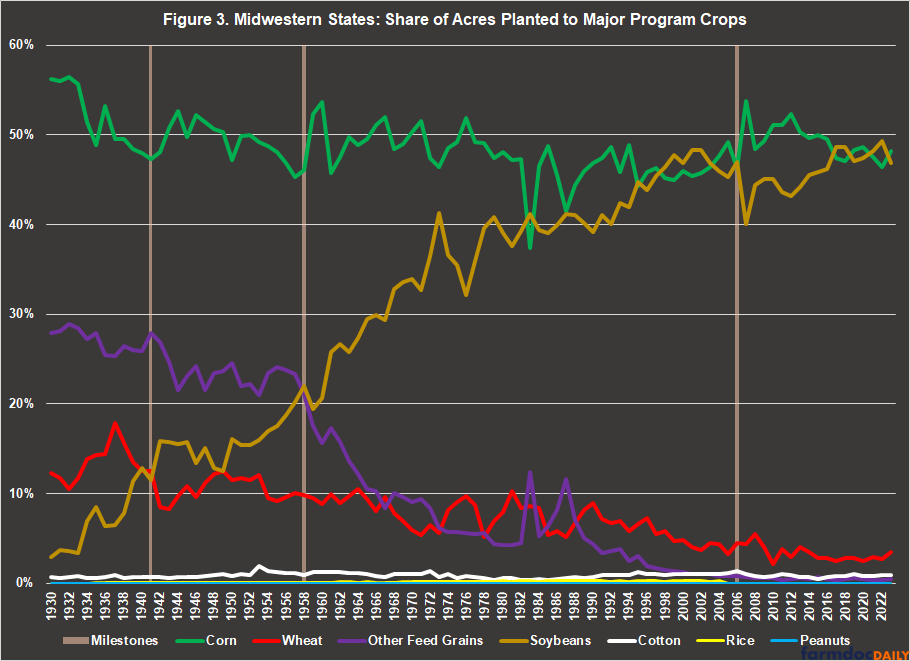
Figure 3 focuses on five Midwestern states: Illinois, Indiana, Iowa, Missouri, and Ohio. For these states, soybean acres as a share of the total planted to the major program crops generally experienced a steady increase from 1930 to 2006, before falling slightly and then rebounding after 2012. The other milestones marked for these states in Figure 3 include: (1) after 1941, acres planted to soybeans exceeded those planted to wheat as a share of the total; and (2) after 1958, acres planted to soybeans exceeded those planted to the other feed grains.
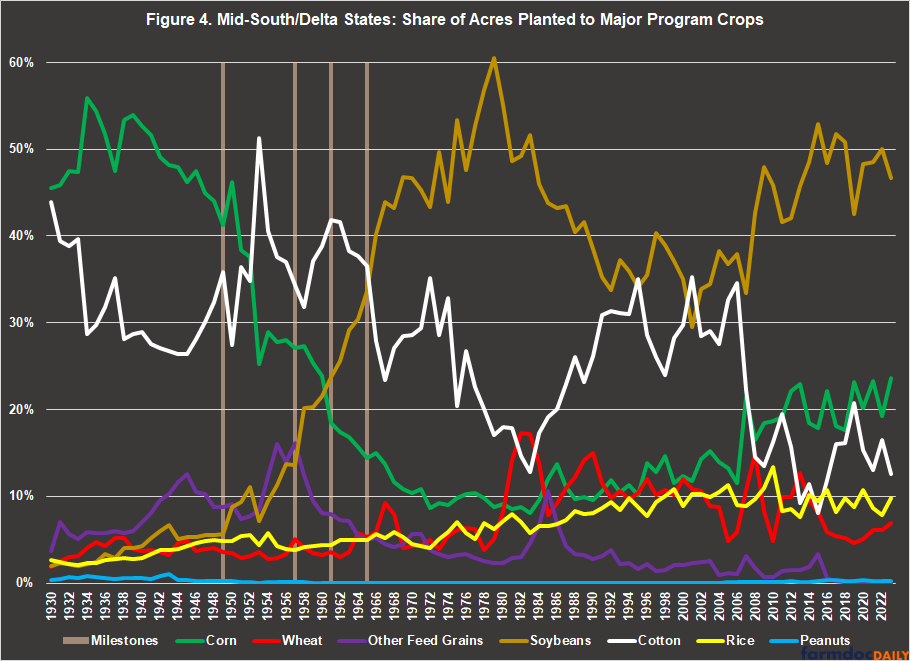
Figure 4 illustrates the share of acres planted for five states in the Mid-Sout/Delta region: Arkansas, Kentucky, Louisiana, Mississippi, and Tennessee. In these states, farmers initially adopted soybeans at a slower rate compared with the Midwestern states. The first milestone is after 1949 when soybean acres surpassed wheat and rice, followed by 1957 when soybean acres surpassed the other feed grains. Soybean acres top corn acres after 1961 and then cotton acres after 1965. Cotton acres rebounded against soybeans as a share of the total acres in the 1980s and through 2007 before falling again.
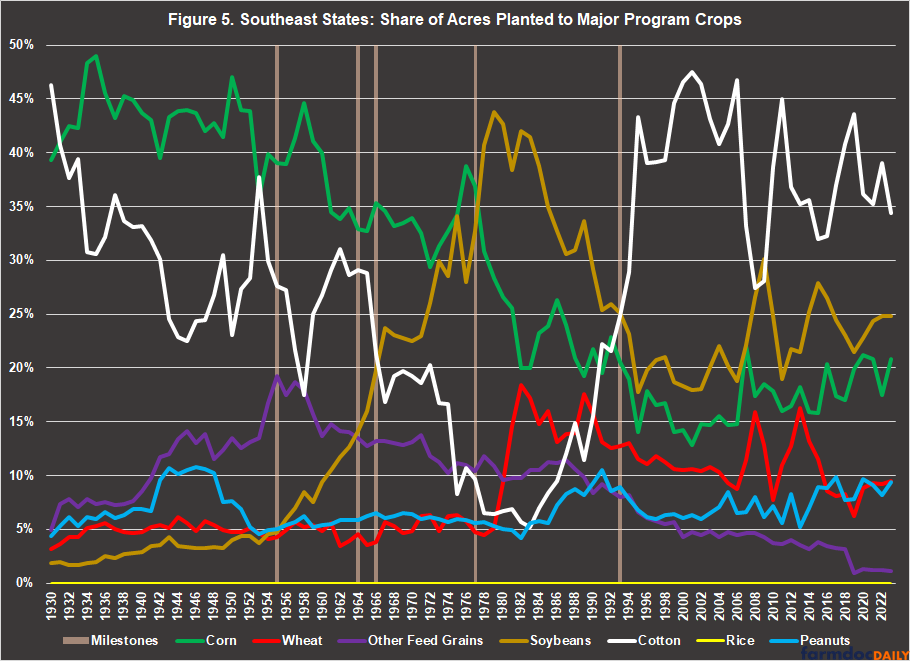
Figure 5 reviews the acres for five states in the Southeast: Alabama, Georgia, North Carolina, South Carolina, and Virginia. The first milestone for soybeans was in 1955 when acres exceeded those for wheat and peanuts. In 1964, soybean acres moved above those for the other feed grains and then above cotton after 1966. In 1977, soybean acres were a larger share of planted acres in these states than corn. Cotton acres rebounded against soybeans after 1993.
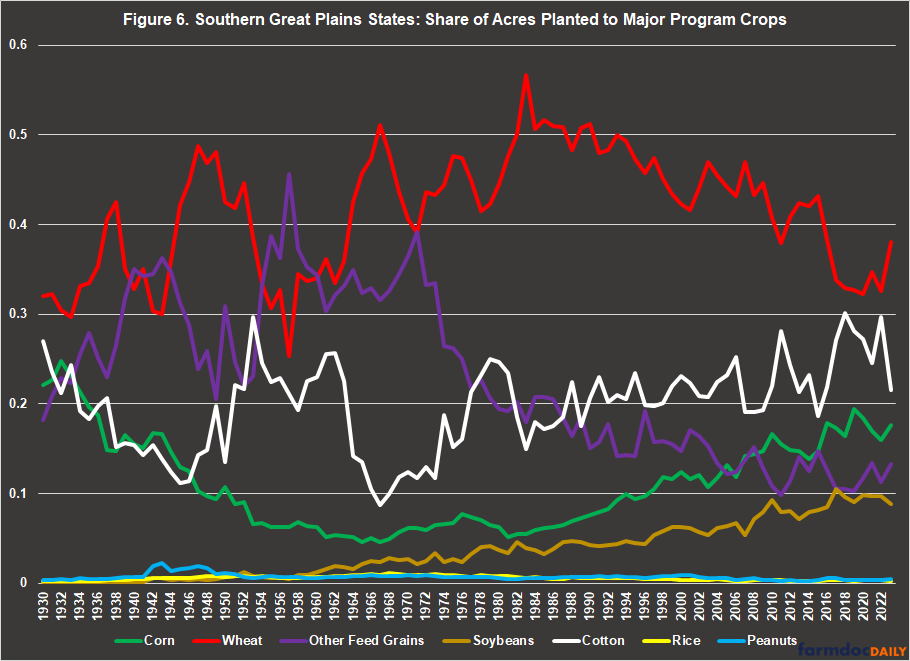
Figure 6 shifts over to states in the Southern Great Plains, specifically: Colorado, Kansas, New Mexico, Oklahoma, and Texas. For the states in this region, there are no milestones. As a share of acres planted to the major commodities, soybeans only exceeded those to planted to peanuts and rice. The share of soybean acres remained below the other major commodities for the entire time reviewed, including the other feed grains.
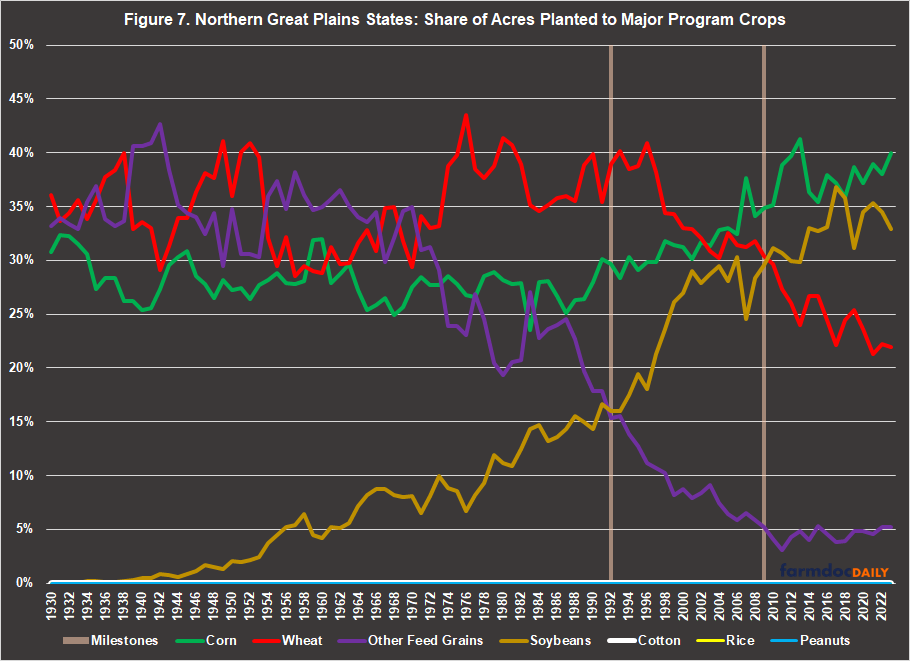
Figure 7 finishes this tour in the states of the Northern Great Plains: Minnesota, Montana, Nebraska, North Dakota, and South Dakota. As a share of total acres planted to the major program crops in these states, farmers were much slower to adopt soybeans. After 1992, the share of acres planted to soybeans exceeded that planted to the other feed grains. After 2009, the soybean footprint was larger than that for wheat as a share of the total acres planted to these program crops.
Concluding Thoughts
The discussion in this article encompasses a regional tour of the adoption of soybeans by American farmers. Farmers have planted soybeans for over 100 years and increased acreage in soybeans significantly during that time. The pace of adoption and the changes in crop rotations were not uniform among the states and crops. The differences in adoption among the regions, as well as the milestones (or lack thereof) in each, provide perspectives that contribute to the story of soybeans in American agriculture. The data on the soybean footprint over time may also help answer questions about the impacts of farm policy on soybeans, as well as the other major program crops. Future articles will build upon the acreage data presented here in search of potential policy changes that impacted adoption of soybeans.
References
Coppess, Jonathan. The Fault Lines of Farm Policy: A Legislative and Political History of the Farm Bill (Lincoln: University of Nebraska Press, 2018). https://www.nebraskapress.unl.edu/nebraska/9781496205124/.
Coppess, J. and J. Hutchins. "Farm Policy and the Brief Saga of Soybeans, Part 1." farmdoc daily (13):217, Department of Agricultural and Consumer Economics, University of Illinois at Urbana-Champaign, November 30, 2023.
Emma, Caitlin. “House sends yet another shutdown-averting bill to Biden's desk.” Politico.com. January 18, 2024. https://www.politico.com/live-updates/2024/01/18/congress/shutdown-averted-00136422.
Foran, Clare, Kristin Wilson, Ted Barrett, and Morgan Rimmer. “Senate passes short-term funding extension as Congress races to avert government shutdown.” CNN.com. January 18, 2024. https://www.cnn.com/2024/01/18/politics/congress-shutdown-deadline-senate/index.html.
Scholtes, Jennifer, Olivia Beavers, and Jordain Carney. “Senate passes funding patch as Johnson bats down last-minute conservative demands.” Politico.com. January 18, 2024. https://www.politico.com/news/2024/01/18/senate-passes-funding-patch-00136326.
Yilek, Caitlin. “Senate clears first hurdle in avoiding shutdown, votes to advance short-term spending bill.” CBSnews.com. January 16, 2024. https://www.cbsnews.com/news/senate-government-shutdown-stopgap-bill-procedural-vote/.
Disclaimer: We request all readers, electronic media and others follow our citation guidelines when re-posting articles from farmdoc daily. Guidelines are available here. The farmdoc daily website falls under University of Illinois copyright and intellectual property rights. For a detailed statement, please see the University of Illinois Copyright Information and Policies here.


