


The Range of New-Crop Price Expectations Is Narrowing Early
Commodity options markets provide implicit estimates of the probabilities associated with future price outcomes. As uncertainty about commodity supply and demand is resolved over time, the range of possible future price outcomes shrinks. This article assesses the market’s current implied price distribution for 2024 new-crop corn and soybean prices as given by the farmdoc Price Distribution Tool and discusses the implications for farmer marketing decisions.
The range of expected price outcomes has narrowed more quickly in 2024 than in recent years. While this season has featured the usual market anxiety about crop conditions, particularly with recent rains and flooding in parts of the western Corn Belt, the overall market situation is substantially more bearish than in the last few years. These findings suggest that farmer marketing decisions should account for this shift in expectations, as markets are signaling that a growing-season rally in new-crop futures is less likely than in previous years.
Current New-Crop Price Levels
Futures prices for fall 2024 new-crop delivery have remained relatively stable since the beginning of the calendar year. Figure 1 illustrates the price history for December 2024 corn and November 2024 soybean futures since January 1. Notably, the observed trading range – roughly 4.50 to 4.90 for corn and 11.40 to 12.20 for soybeans – is smaller than the corresponding period trading ranges in recent years.
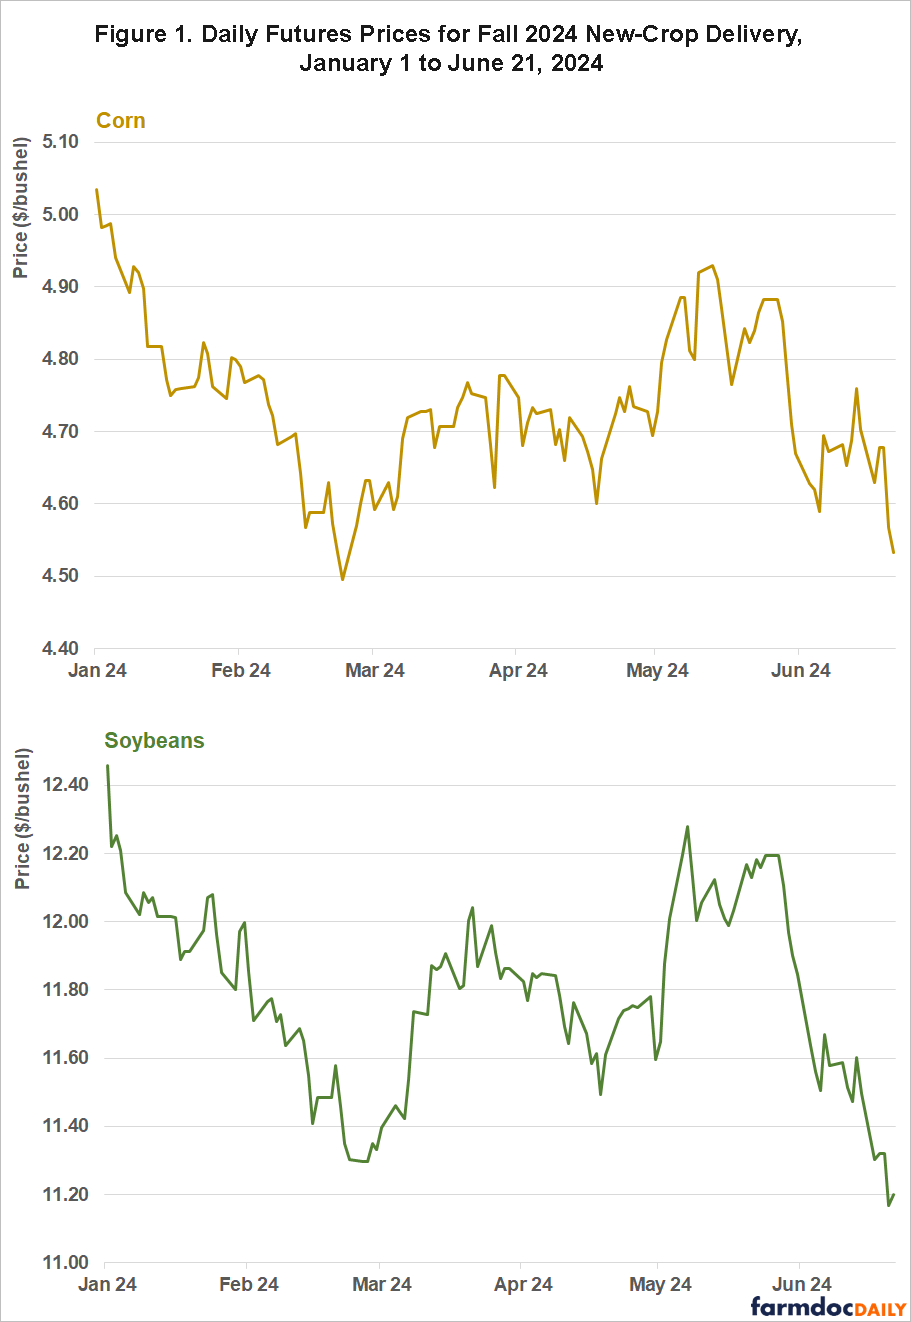
These new-crop price expectations provided by futures prices are generally lower than in recent years. Consequently, there is evidence suggesting that farmers have resisted selling at these prices (Huffstutter and Plume, June 17, 2024). Whether waiting to sell is profitable can be informed by the probability of observing higher or lower price levels in the future.
The Distribution of New-Crop Price Expectations
While futures markets provide information about forthcoming price levels, options markets offer insights into forthcoming price variability, or the likelihood for futures prices to change by any given amount prior to the expiration of the options contract. To extract this probabilistic information from options markets, prices of both puts and calls across actively traded options strike prices are used to recover the best fitting distribution of possible future prices. This approach is similar to pricing options based on the Black-Scholes option pricing model but solves the model backwards across all options simultaneously to derive implied price probabilities that best explain observed options prices.
Implied price probability distributions are readily available and updated in real-time on the Price Distribution Tool at the farmdoc website. This tool allows users to select an underlying futures contract and returns probabilistic price forecasts applicable to the remainder of the contract life.
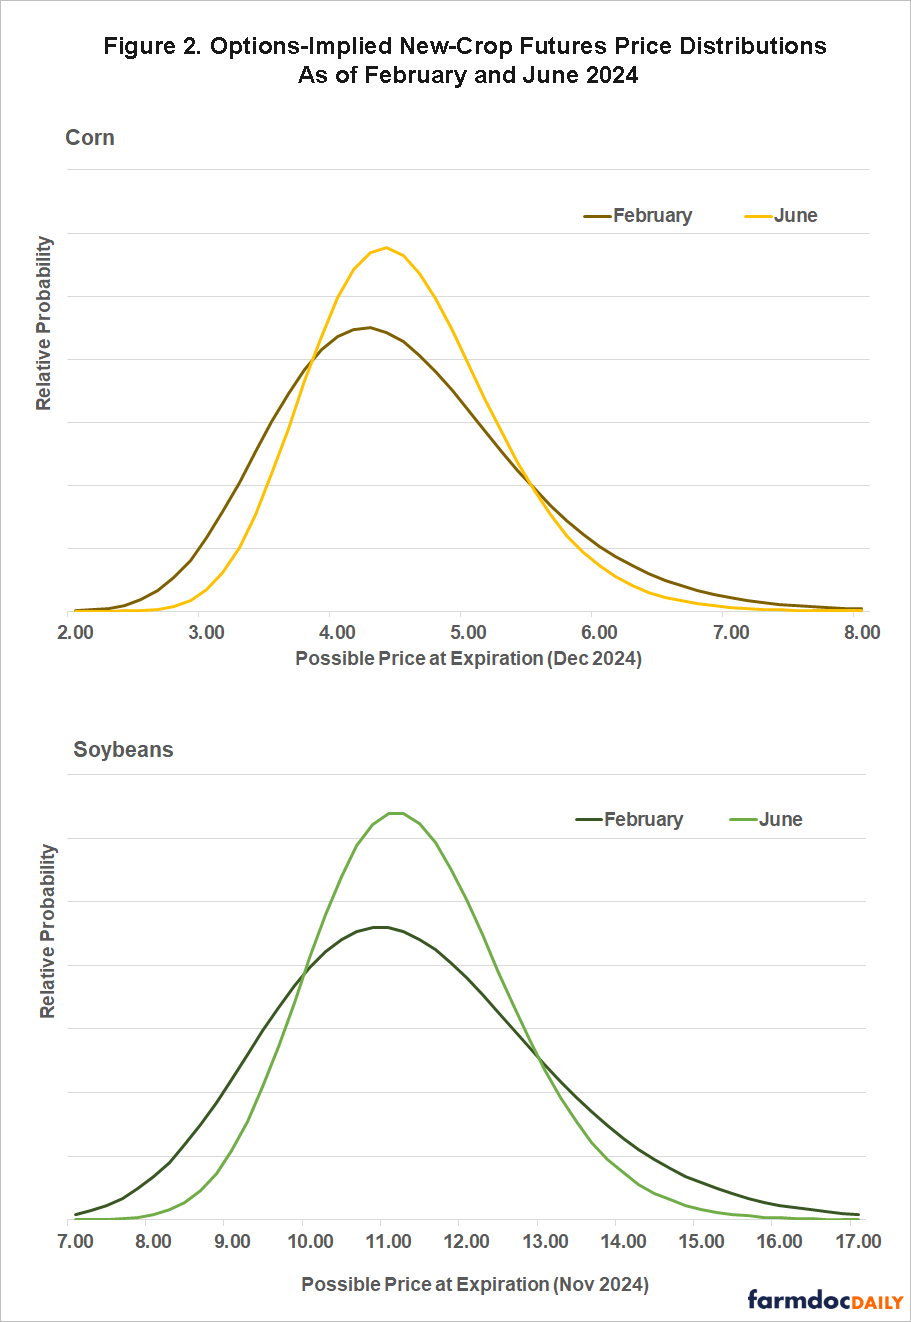
New-crop futures price distributions based on observed options prices as of February 23, 2024 and June 21, 2024 are shown in Figure 2. The February distribution summarizes market conditions when planting decisions are made and price guarantees for crop insurance are established. The June date represents the recent market conditions. The plotted curves indicate estimated relative probabilities for potential price outcomes given on the x-axis. Prices near the center of the distribution are viewed by the options market as more likely, while those away from the center are less likely.
Analysis of Price Distribution Changes
The range or spread of the price distribution quantifies the uncertainty around new-crop prices. For both corn and soybeans, the range of new-crop prices viewed as likely has shrunk significantly between February and June. The decrease in uncertainty can be seen in the degree to which the distributions in figure 2 become more peaked (less spread out) over time. While the center of the distribution has not moved considerably because price levels have been relatively stable between February and June, values further away from the center of the distribution are now viewed as less likely.
To formally describe the range of potential price outcomes, the interquartile range – the difference between the 75th and 25th percentiles of the distribution – is calculated. The interquartile range quantifies the spread in the central 50% of the probability distribution. For corn, this range narrowed from $1.23/bushel in February to $0.95/bushel in June, representing a 23% decrease. Similarly, the probability of specific price outcomes has shifted. For instance, the options-implied probability of a December 2024 corn futures price below $4.00/bushel decreased from 32% in February to 24% in June. Likewise, the probability of a price above $5.00/bushel fell from 27% to 24% over the same period.
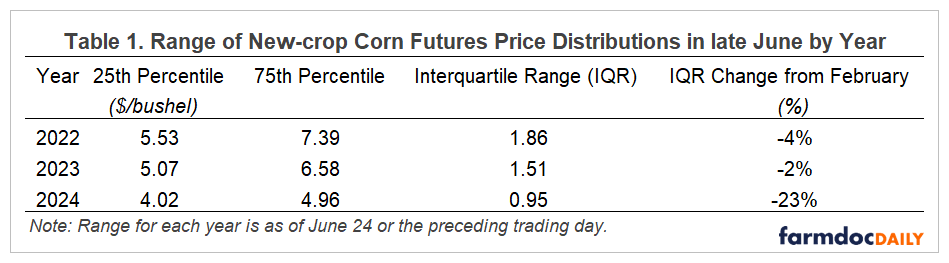
It is typical for the range of options-implied price distribution to narrow over time (e.g. farmdoc daily, August 1, 2014; February 20, 2018) as uncertainty about planted acreage, weather, and other supply and demand factors is resolved. However, the range of anticipated prices has shrunk more quickly in 2024 than in the last few years, especially for corn. To see this, compare the change in the range of the expected corn price distribution between February and June for 2024 with that for 2022 and 2023 in Table 1. While the interquartile range of corn price expectations has decreased by 23% this year, it declined by only 2% in 2023 and by 4% in 2022.
Implications for Crop Marketing
Lower price levels and a narrower range of expected price outcomes indicates that the market believes that the remainder of 2024 will have lower price volatility than in previous years. The dynamics of options-implied new-crop price distributions for corn and soybeans in 2024 suggest the potential for a jump in new-crop futures prices is dwindling more quickly than usual. While seasonal rallies in the June to August growing season are typically viewed as a good time to make pre-harvest sales (farmdoc daily, June 2, 2021), markets appear to signal that a substantial growing season price increase is less likely in 2024 than in recent seasons.
The notion that “the market is never wrong” suggests that market prices for futures and options provide the best available signal to market participants about commodity value. In this case, the distributional price forecasts from corn and soybean options prices indicate a growing rally in new-crop futures is less likely than in previous years. Although some analysts have suggested the market may be “assuming too much” or at least moving too quickly in that direction, (e.g., Setzer, June 17, 2024) the market continues to signal lower and less volatile corn and soybean prices than in recent years. This shift in market expectations should inform farmers’ marketing strategies for the coming season.
References
Janzen, J. "The Weather Risk Premium in New-Crop Corn Futures Prices." farmdoc daily (11):88, Department of Agricultural and Consumer Economics, University of Illinois at Urbana-Champaign, June 2, 2021.
Price Distribution Tool. https://fd-tools.ncsa.illinois.edu/pricedistribution
Setzer, Angie. “Is The Grain Market Assuming Too Much Too Soon?” Barchart, June 17, 2024. https://www.barchart.com/story/news/26867506/is-the-grain-market-assuming-too-much-too-soon
Sherrick, B. "Updated Expected Price Distributions for Corn and Soybeans in 2014." farmdoc daily (4):143, Department of Agricultural and Consumer Economics, University of Illinois at Urbana-Champaign, August 1, 2014.
Sherrick, B. and G. Schnitkey. "Implied Probabilities for Corn and Soybeans Prices in 2018." farmdoc daily (8):29, Department of Agricultural and Consumer Economics, University of Illinois at Urbana-Champaign, February 20, 2018.
Disclaimer: We request all readers, electronic media and others follow our citation guidelines when re-posting articles from farmdoc daily. Guidelines are available here. The farmdoc daily website falls under University of Illinois copyright and intellectual property rights. For a detailed statement, please see the University of Illinois Copyright Information and Policies here.