


The Dynamics of Sweet Cherry Orchards: Trends and Transitions from 2008 to 2023
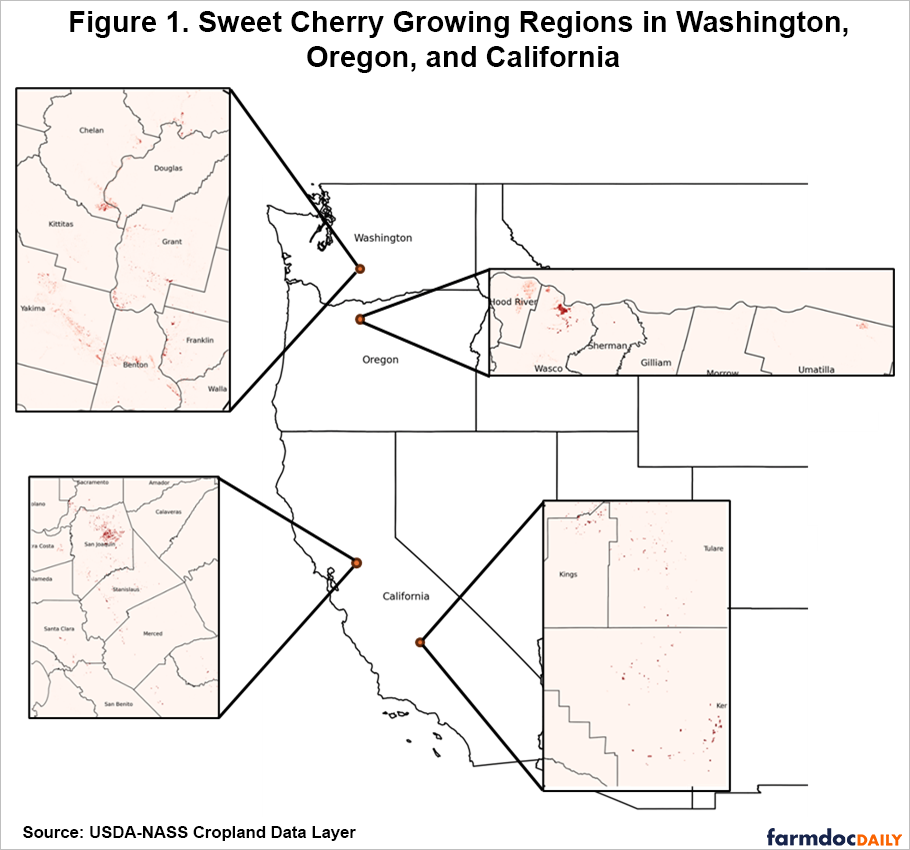
The sweet cherry industry in the United States is primarily concentrated in Washington, California, and Oregon (Figure 1), accounting for over 90 percent of the nation’s total production in 2023 (Figure 2). Washington leads in production with 443,640 tons, followed by California with 317,736 tons, and Oregon with 58,765 tons (USDA-NASS, 2022). The sweet cherry industry faces challenges such as pest and disease pressures, as well as significant land use transitions. This article summarizes the changes in the production of sweet cherries in the US and discusses the dynamics of land use transitions based on data from the USDA Cropland Data Layer (USDA-NASS, 2024), USDA-NASS census (USDA-NASS, 2024), and USDA-AMS specialty crop shipment dataset (USDA-AMS, 2024).
Sweet Cherry Production
Over the past 15 years, domestic sweet cherry production in the United States has experienced significant growth, increasing from 330 million pounds in 2008 to 550 million pounds in 2023. In 2008, Washington and California were the dominant sweet cherry producers, accounting for 44% and 47% of the total production, respectively (Figure 2). However, by 2023, Washington’s share had increased to 62%, while California’s share decreased to 32%. This shift in production underscores Washington’s growing importance as a key player in the sweet cherry industry. Oregon’s sweet cherry production has remained stable, consistently accounting for 5% of the total sweet cherry production in the country between 2008 and 2023, highlighting the state’s consistent contribution to the industry (Figure 2). Overall, the increase in domestic sweet cherry production, coupled with a rise in cherry exports and a decrease in imports, demonstrates the strong growth and competitiveness of the U.S. sweet cherry market.

Sweet Cherry Land Use Trends
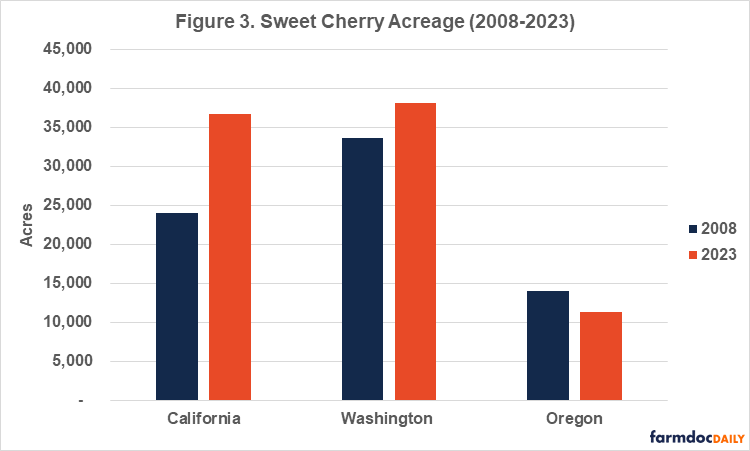
From 2008 to 2023, the acreage of sweet cherry orchards in Washington, the prominent producing region, increased by 14% (Figure 3). This growth can be attributed to the consistent demand for premium cherry varieties like Bing and Rainier. Washington’s advanced irrigation systems, particularly in the Yakima Valley and Wenatchee areas, have also played a role in supporting large-scale cherry production (WSU Tree Fruit, 2021). California experienced a significant 52% increase in sweet cherry acreage over the same period (Figure 3). Part of this increase can be attributed to the introduction of new cherry varieties that are better suited to California’s diverse climatic regions. These advancements allow growers to produce high-quality cherries for an extended period and capitalize on early and late-season market opportunities (Marino et al., 2020). In contrast, Oregon has experienced a 19% decline in sweet cherry orchard acreage over the last 15 years (Figure 3). This decline can be attributed to several key environmental factors, including water availability and pest pressures. Cherry cultivation has become increasingly challenging in parts of Oregon facing water scarcity due to prolonged drought conditions (OSU Extension services, 2023). Furthermore, policies promoting sustainable agricultural practices have incentivized transitions from intensive crop production to more sustainable uses, such as grassland or pastureland. This shift away from cherry cultivation is often supported by state and federal programs that encourage land conservation and sustainable agricultural practices (USDA-NRCS, 2023).
Our analysis reveals notable shifts in cherry orchard acreage in Washington, California, and Oregon from 2008 to 2023. The percentages of acres remaining as cherry orchards during this period were 29%, 26%, and 42% in Washington, California, and Oregon, respectively. This suggests that new cherry orchards were established in areas with more suitable conditions, while old cherry orchards were replaced by other land uses, considering the overall growth of the cherry industry in the last 15 years. A prominent trend, for example, is the bidirectional transition in Washington between apple and cherry orchards, due to the similarity in management and climatic requirements of these crops. Our analysis shows a net 14% increase in the apple-to-cherry transition in Washington during the 2008-2023 period. In California, the primary land use transition observed is the walnut-cherry scheme. Additionally, over 10% of cherry orchards in California have transitioned to almond production. Furthermore, 14% of newly established cherry orchards have replaced grassland/pastureland areas in the past 15 years. Oregon’s primary land use transition has been from grassland/pastureland or shrubland to cherry orchards, representing a net 5% increase. This shift may indicate a strategic move by farmers to adopt more sustainable land management practices, potentially driven by economic returns and environmental considerations.
The Impact of Pests and Disease
Pest and disease pressures, such as the spread of the spotted wing drosophila and Western X-disease, have increased the cost and complexity of managing cherry orchards. The spotted wing drosophila affects soft-skinned fruits like cherries, leading to increased pesticide use and higher production costs, which can deter growers from continuing cherry production (OSU Extension services, 2023). For example, the Western X-disease epidemic in Washington and Oregon from 2015 to 2020 resulted in lost revenues valued at $65 million and re-establishment costs estimated at $115 million (DuPont et al., 2021; Molnar et al., 2022). Since infected cherry trees cannot be cured (Molnar et al., 2022), removing infected trees is the primary control measure to restrict further disease spread (Adaskaveg et al., 2009; Molnar et al., 2022). This practice imposes additional opportunity costs on cherry producers and unanticipated shocks to the industry.[1]
Conclusion
The U.S. sweet cherry industry has seen notable changes over the 2008-2023 period. Washington has emerged as the leading producer, benefiting from increased orchard acreage and advanced agricultural practices. California has also expanded its acreage by introducing new cherry varieties. In contrast, Oregon has seen a decrease in acreage due to environmental challenges and a shift towards sustainable land use practices. Land use transitions, such as apples-to-cherries in Washington and grassland-to-cherries in Oregon, reflect the industry’s adaptability to market and environmental pressures. However, the industry continues to face significant challenges. Pest and disease issues, such as the spotted wing drosophila and Western X-disease, have increased management costs and caused economic losses. These challenges highlight the need for adaptive strategies and innovation in the sweet cherry industry.
Note
[1] An opportunity cost is the value of the next best alternative forgone when a choice is made.
References
Agriculture: Pest Management Guidelines / UC Statewide IPM Program (UC IPM). https://ipm.ucanr.edu/agriculture/cherry/x-disease-cherry-buckskin/
DuPont, T., Harper, S., Northfield, T., & Nottingham, L. (2021). X-disease phytoplasma (Western X) | WSU Tree Fruit | Washington State University. http://treefruit.wsu.edu/crop-protection/disease-management/western-x/
Marino, G., Arnold, K., Nouri, M., Suvočarev, K., Brown, P., Amaral, D., Adaskaveg, J., & Trouillas, F. (2020). 2020 CALIFORNIA CHERRY RESEARCH REPORT.
Molnar, C., DuPont, T., & Thompson, A. (2022). Estimated Impact of X-disease and Little Cherry Disease in Washington and Oregon from 2015 to 2020. Journal of Extension, 60(4). https://doi.org/10.34068/joe.60.04.17
OSU Extension services. (2023). Beating the Heat: A Statewide Assessment of Drought and Heat Mitigation Practices (and Needs) with Oregon Farmers and Ranchers (Link).
USDA-AMS. (2024). Run a Custom Report | Agricultural Marketing Service. https://www.ams.usda.gov/market-news/custom-reports
USDA-NASS. (2022). USDA - National Agricultural Statistics Service—Data and Statistics. https://www.nass.usda.gov/Data_and_Statistics/
USDA-NASS, C. (2024). CroplandCROS. https://croplandcros.scinet.usda.gov/
USDA-NASS, Q. (2024). USDA/NASS QuickStats Ad-hoc Query Tool. https://quickstats.nass.usda.gov/
USDA-NRCS. (2023, November 7). Conservation Stewardship Program—Oregon | Natural Resources Conservation Service. https://www.nrcs.usda.gov/programs-initiatives/csp-conservation-stewardship-program/oregon/conservation-stewardship-program
WSU Tree Fruit. (2021). Crop Production | Yakima County | Washington State University. Yakima County. https://extension.wsu.edu/yakima/crop-production/
Disclaimer: We request all readers, electronic media and others follow our citation guidelines when re-posting articles from farmdoc daily. Guidelines are available here. The farmdoc daily website falls under University of Illinois copyright and intellectual property rights. For a detailed statement, please see the University of Illinois Copyright Information and Policies here.