


The Liquidity of Illinois Grain Farms: Current Ratio by Region
This article continues our examination of the current ratio trends of Illinois grain farms using data obtained from the Illinois Farm Business Farm Management (FBFM). It builds on our previous analysis (see farmdoc daily, January 9, 2025), where we found substantial differences in the distribution of the current ratio of grain farms across the state when the upper quartile, median, and lower quartile values were compared. Specifically, we found that the upper quartile values were considerably higher than both the median and lower quartile values. We will now consider how the distribution of the current ratio differs by region.
The current ratio is one of several liquidity measures used to evaluate a farm’s ability to meet its short-term financial obligations as they come due. It is calculated by dividing the value of a farm’s current assets by its current liabilities. In other words, this ratio assesses a farm’s capacity to pay off its short-term liabilities using its short-term assets. According to the Farm Financial Scorecard developed by the Center for Farm Financial Management, a farm with a current ratio that is less than 1.3 is categorized as vulnerable, a ratio between 1.3 and 2.0 is categorized as cautionary, and a ratio that is greater than 2.0 is categorized as strong.[1] Therefore, the higher the current ratio, the more liquid the farm is.
In this article, we report the trends in the average, lower quartile, median, and upper quartile current ratios of grain farms across three regions—Northern, Central, and Southern Illinois. Quartiles divide sorted data into four groups, each containing an equal number of values. For the current ratio, the first quartile (lower quartile) represents the value below which 25% of the current ratio values fall, indicating that 25% of farms have a current ratio lower than this value. The second quartile is the median of the dataset, meaning that 50% of the current ratio values are below this point. This represents the middle value of the current ratio for all grain farms. The third quartile (upper quartile) is the value below which 75% of the current ratio values fall. This means that 75% of farms have a current ratio less than this value. In the top panel of our figure, we use the color-coding system from the Farm Financial Scorecard to indicate the category of each farm’s current ratio. The region shaded in red indicates a vulnerable ratio, yellow represents a cautionary ratio, and green indicates a strong ratio. Finally, in the bottom panel of our figure, we display the trends of the two components that make up the current ratio by calculating the annual average current assets and current liabilities across all grain farms by farm size. It is important to note that calculating the current ratio from these values does not equate to the average reported current ratio in the top panel of the figure. An example is provided in the appendix of this article.
Figure 1 shows the average, lower quartile, median, and upper quartile of the current ratio for grain farms across the three regions of Illinois, as well as the average current assets and liabilities from 2003 to 2023. Similar to what we have seen in the other liquidity measures we have examined, the current ratio in Central Illinois shows the least variability compared to Northern and Southern Illinois. Furthermore, the trend in the average current ratio in Central Illinois most closely mirrors that of the upper quartile. The trends in the two measures are also similar for Northern Illinois, for the most part, although we did see larger differences between them during the 2000s. Grain farms in Southern Illinois experienced the largest fluctuations in both the average and upper quartile current ratios. In fact, Southern Illinois reported the highest average current ratio in 2011, reaching a value of 11.0 (strong). However, this region also had the lowest value for this measure in 2017, falling as low as 2.40 (strong).

When considering the distributional differences within each region based on the median, upper, and lower quartiles, we see that these differences are much tighter in Southern Illinois. Additionally, the upper quartile current ratio in Southern Illinois has generally been lower compared to the other two regions. However, the median and lower quartile values are quite similar across the three regions, with Southern Illinois generally reporting lower values. This trend is partly explained by the higher yield variability due to the lower soil quality in Southern Illinois, and the region’s sensitivity to excess precipitation and drought.
Conclusion
In conclusion, our analysis of the current ratio trends across Northern, Central, and Southern Illinois grain farms reveals notable regional differences in farm liquidity. The average current ratios in Northern and Central Illinois have demonstrated a sustained improvement since 2003, whereas Southern Illinois tells a story of recovery, given the substantial deterioration in liquidity the region experienced in the 2010s. When considering the distributional differences within each region of the median, upper, and lower quartiles of the current ratio, we see that these differences are much tighter in Southern Illinois. Although Southern Illinois generally reported lower upper quartile values, the median and lower quartile values were quite similar across the regions.
Acknowledgment
The authors would like to acknowledge that data used in this study comes from the Illinois Farm Business Farm Management (FBFM) Association. Without Illinois FBFM, information as comprehensive and accurate as this would not be available for educational purposes. FBFM, which consists of 5,000+ farmers and 70 professional field staff, is a not-for-profit organization available to all farm operators in Illinois. FBFM field staff provide on-farm counsel along with recordkeeping, farm financial management, business entity planning and income tax management. For more information, please contact our office located on the campus of the University of Illinois in the Department of Agricultural and Consumer Economics at 217-333-8346 or visit the FBFM website at www.fbfm.org.
Note
[1] The Farm Financial Scorecard adheres to the guidelines set by the Farm Financial Standards Council
References
Mashange, G., B. Zwilling and D. Raab. "The Liquidity of Illinois Grain Farms: Current Ratio." farmdoc daily (15):6, Department of Agricultural and Consumer Economics, University of Illinois at Urbana-Champaign, January 9, 2025.
Appendices
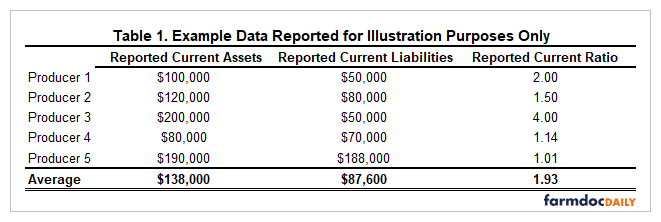
The data presented in Table 1 is fictional and will be used to illustrate how the average reported current ratio, displayed in the top panel of Figure 1, differs from the current ratio that would be obtained by dividing the average current assets by the average current liabilities shown in the bottom panel. Suppose in a given year, we have five producers reporting their current assets and liabilities. The first step is to calculate the current ratio for each producer by dividing their current assets by their current liabilities, shown in the fourth column of Table 1. Next, we calculate the average values of current assets, current liabilities, and the current ratio, shown in the table's bottom row. The average reported current ratio in that year would be 1.93. However, if we try to calculate the current ratio by dividing the average current assets by the average current liabilities, whose values would be shown in the bottom panel of Figure 1, we will obtain a value of 1.58 and not 1.93.
Disclaimer: We request all readers, electronic media and others follow our citation guidelines when re-posting articles from farmdoc daily. Guidelines are available here. The farmdoc daily website falls under University of Illinois copyright and intellectual property rights. For a detailed statement, please see the University of Illinois Copyright Information and Policies here.