


Trends in General Inflation and Farm Input Prices
Recent consumer and producer surveys indicate that individuals are expecting inflation in the next year to be higher than it was in 2024. Though not perfectly correlated, input prices for agricultural producers can be affected by changes in general inflation. During the 1973 to 2024 period the average annual increase for the implicit price deflator for personal consumption expenditures and the USDA agricultural price index for production items were 3.4% and 3.8%, respectively. The correlation between the annual rates for these two indices was 0.61 over this period. Some individuals may wonder why these two indices are not more closely linked. The reason is rather simple. Each input used in production agriculture and in other industries has its own set of supply and demand fundamentals. This article compares and contrasts trends in general inflation with input price changes in U.S. production agriculture in the last decade. In so doing, it updates input price and inflation information contained in Langemeier (2023).
Long-Term Relationships
Before discussing long-term relationships between general inflation and farm input prices, it is important to define key terms. Inflation represents the decline in purchasing power of a currency over time (Investopedia, 2022). Quantitative estimates of the rate of inflation are typically made by examining the increase or decrease in the price levels of a basket of selected goods. Inflation measures include the consumer price index and implicit price deflators. Though computed using different methodologies, inflation measures are highly correlated over time. Most economists would agree that an increase in the supply of money is the root cause of inflation. Inflation mechanisms can be classified into three types: demand-pull inflation, cost-push inflation, and built-in inflation (Investopedia, 2022). When an increase in the money supply increases overall demand more than the productive capacity of an economy, we have demand-pull inflation. When production costs increase prices, we have cost-push inflation. Quality improvements and technological change are often incorporated into cost-push inflation. Quality improvements would increase prices while technological change tends to reduce prices. Finally, when individuals expect current inflation rates to continue in the future, we have built-in inflation. In general, the longer above average inflation rates persist, the more important built-in inflation becomes. All three of these types of inflation mechanisms have contributed to the inflation we have witnessed in the last couple of years.
As noted above, input price changes in production agriculture and other industries are due to general inflation and its mechanisms as well as supply and demand fundamentals specific to a particular input. Having said that, some inputs are more closed aligned or correlated with general inflation than other inputs.
Using information for the 1973 to 2024 period from the Federal Reserve Bank of St. Louis on inflation rates and farm input price indices from USDA-NASS, we examined the correlation between the implicit price deflator for personal consumption expenditures and agricultural production items (i.e., general input price index for production agriculture), feed, seed, fertilizer, fuels, labor, and machinery. The correlation coefficient between the implicit price deflator and agricultural production items was 0.61. The average annual rate of change for agricultural input prices over the period was slightly higher (3.8 percent) than the rate of change for the implicit price deflator (3.4 percent). The average annual price changes for labor (4.4 percent) and machinery (5.3 percent) were significantly higher than the average increase in the implicit price deflator. In terms of the six specific input categories examined, the only correlation between the implicit price deflator and a specific input price change that was not significantly different from zero was the correlation between the implicit price deflator and feed prices. The correlations between the implicit price deflator, and labor and machinery were relatively higher than the correlation between the implicit price deflator and general farm price index (i.e., agricultural production items). This is an important result because it suggests that input prices for labor and machinery more closely follow trends in general inflation than input prices for items such as feed, seed, fertilizer, and fuels.
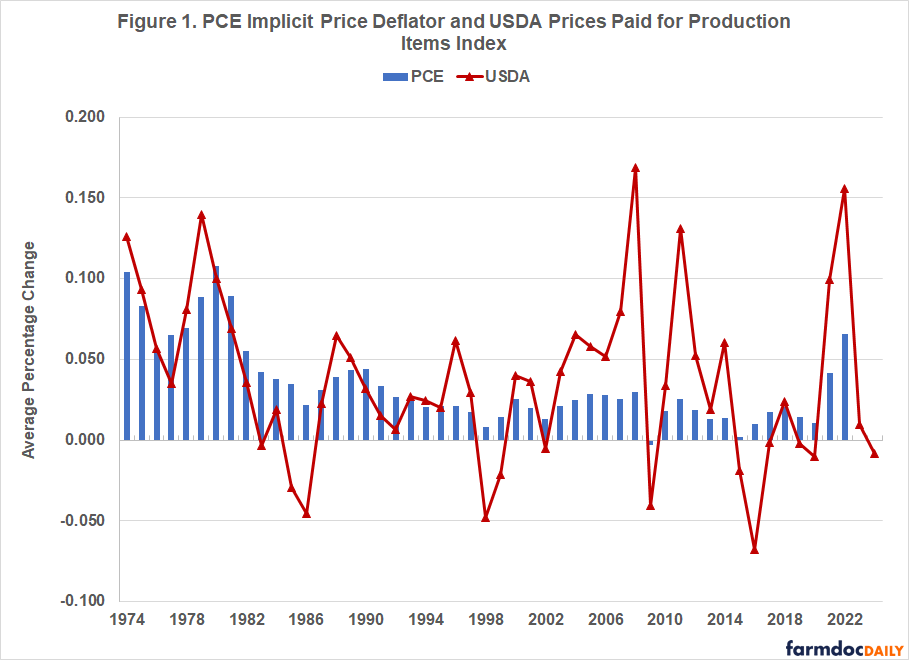
Figure 1 illustrates rates of change for general inflation and agricultural input prices from 1974 through 2024. Agricultural input prices appear to be substantially more variable than general inflation rates. General inflation was above 10% in 1980. In contrast, agricultural input prices were above 10% in 5 years and above 15% in 2008 and 2022. Relative variability can be measured using the coefficient of variation which is computed by dividing the standard deviation by the average. The coefficient of variation for the rate of change in agricultural production items was 84 percent higher than the coefficient of variation for the implicit price deflator. The coefficients of variation for feed, fertilizer, and fuels were higher than the coefficient of variation for the more general farm input price index (i.e., agricultural production items). The coefficient of variation for the input price index for labor was smaller than the coefficient of variation for general inflation.
Historical Trends in General Inflation and Farm Input Prices
This section compares and contrasts the 1-year, 5-year, and 10-year averages for the implicit price deflator for personal consumption expenditures and farm input prices. Data for the implicit price deflator were obtained from the Federal Reserve Bank of St. Louis. With the exception of fertilizer and diesel, data for the farm inputs were obtained from USDA-NASS. Fertilizer and diesel price data were obtained from USDA-AMS (i.e., Illinois Production Report).
Table 1 presents the average price changes for inflation and farm inputs for 2024, for the 2020 to 2024 period, and for the 2015 to 2024 period. The first thing that becomes immediately apparent is how much lower inflation was in 2024 compared to the 5-year average. General inflation in 2024 was similar to the 10-year average. The rate of change for agricultural production items in 2024 was negative. The 10-year average for this item was 2.0%, slightly below the 10-year average for general inflation.
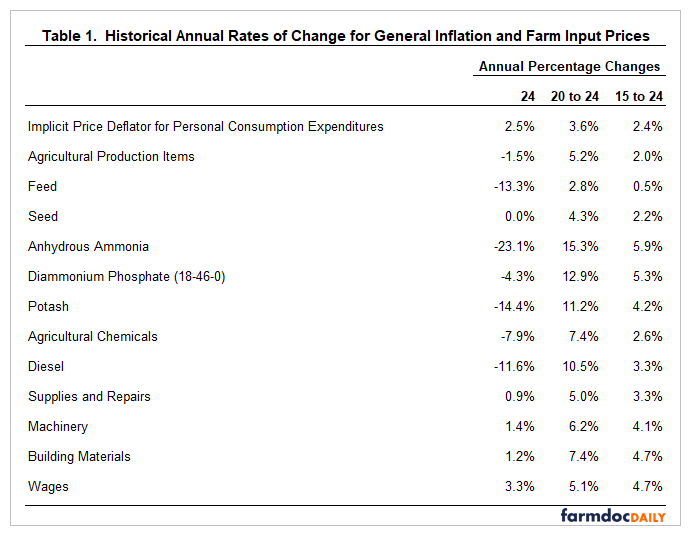
Now let’s compare the rate of general inflation to individual farm input price changes. For the annual change from 2023 to 2024 (labeled 2024 in Table 1), the input price changes for all of the farm inputs except for labor were lower than the annual change in the implicit price deflator or general inflation. Feed, anhydrous ammonia, potash, and diesel experienced annual price declines larger than 10%. After increasing during the 2020 to 2023, the price for anhydrous ammonia decreased 23.1% in 2024. Turning to the 10-year averages, the only individual farm input listed in Table 1 with a price change smaller than or equal to the rate of change in general inflation was feed. The 10-year input price increases for anhydrous ammonia and diammonium phosphate exceeded 5 percent, which was more than double the annual rate of change in general inflation. The results in Table 1 illustrate how much of an outlier the price changes in 2024 were compared to the long-run averages.
Recent Trends in General Inflation and Farm Input Prices
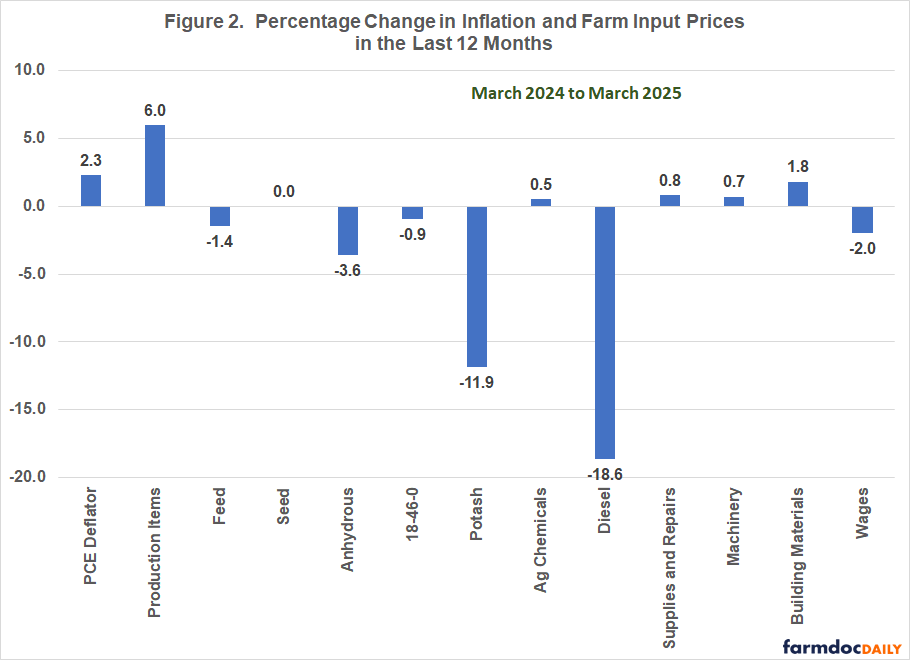
Figure 2 illustrates average input prices for the latest 12 months for which data were available (i.e., March 2024 to March 2025). The percentage change in the implicit price deflator was 2.3 percent. This is down sharply from the annual average in 2021, 2022, and 2023 (i.e., 4.1 percent, 6.3 percent, and 3.7 percent, respectively), but is similar to the 10-year average. With the exception of the index for agricultural production items, the input price changes for all of the inputs listed in Figure 1 were below the annual price change for general inflation. The production items index increased 6.0% over the last 12 months. Obviously, this index was impacted by inputs other than those listed in Figure 1. In particular, it is important to note that the index for purchased livestock was up sharply during the last 12 months. The results in Figure 1 can be used to help explain why the breakeven prices for corn and soybeans declined approximately 8 percent and 5 percent, respectively, in 2024 after increasing sharply in 2022 and 2023.
Concluding Comments
This article discussed trends in general inflation and farm input prices. Over long periods of time, farm input prices are significantly correlated with general inflation. However, farm input prices are by no means perfectly correlated with general inflation. Each input has its own supply and demand fundamentals. Farm input price indices for machinery and labor were more correlated with general inflation than feed, seed, fertilizer, and fuels.
For the input price categories examined, the rates of change were below the inflation rate for the implicit price deflator for personal consumption expenditures during the last 12 months. Given the recent imposition of tariffs, this may or may not be the case in the upcoming year. Both consumer and producer surveys indicate that general inflation is expected to be higher than the 2.3% experienced in 2024. Thus, rather the declines, we could experience increases in crop breakeven prices in the upcoming year.
References
Federal Reserve Bank of St. Louis. FRED Economic data, accessed on April 4, 2025. https://fred.stlouisfed.org/
Fernando, J., M.J. Boyle, and P. Rathburn. “Inflation.” Investopedia, Updated January 12, 2022. https://www.investopedia.com/terms/i/inflation.asp
Langemeier, M. "Trends in General Inflation and Farm Input Prices." farmdoc daily (13):70, Department of Agricultural and Consumer Economics, University of Illinois at Urbana-Champaign, April 14, 2023.
USDA-AMS. Illinois Production Reports, accessed on April 4, 2025. https://mymarketnews.ams.usda.gov/viewReport/3195
USDA-NASS. Quick Stats, accessed on April 4, 2025. https://quickstats.nass.usda.gov/
Disclaimer: We request all readers, electronic media and others follow our citation guidelines when re-posting articles from farmdoc daily. Guidelines are available here. The farmdoc daily website falls under University of Illinois copyright and intellectual property rights. For a detailed statement, please see the University of Illinois Copyright Information and Policies here.