


Support Price, Cost of Production, and the 21st Century
A defining feature of the 2025 Farm Bill is higher statutory reference prices. A central rationale for the increase was higher cost of production. Relative to cost per trend output unit for the nine crops that USDA (US Department of Agriculture) computes cost, the 2025 statutory reference prices average 3% lower than for the 2019 crop year, the first under the 2018 Farm Bill, and 9% lower than the target prices for the 2002 crop year. These comparisons imply the 2025 Farm Bill statutory reference prices are not out-of-line, even somewhat less than the increases in cost to produce US crops so far in the 21st Century.
Data and Procedures
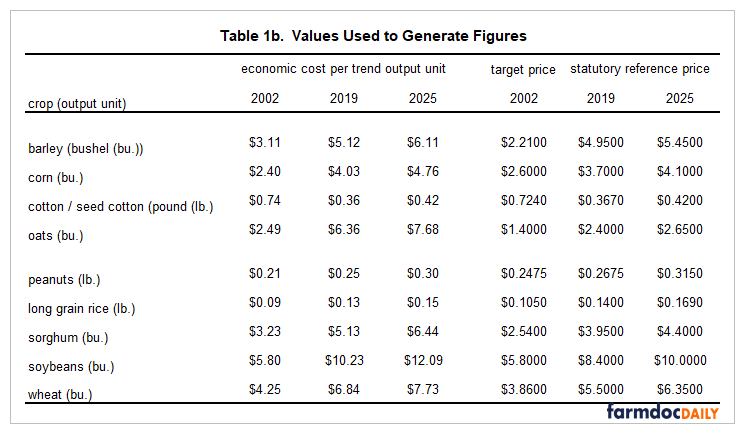
Cost per trend output unit takes both cost per acre and yield into account. USDA, ERS (Economic Research Service) computes an economic cost of production per acre. It is divided by an estimate of US trend yield obtained from a linear time trend regression over the 1974-2024 crop years. Table 1a in the Data Note at the end of this article contains the economic cost per acre and trend yield estimate for barley, corn, cotton / seed cotton, oats, peanuts, long grain rice, sorghum, soybeans, and wheat for 2002, 2019, and 2025. These are the initial crop year under, respectively, the 2002, 2018, and 2025 Farm Bill. Table 1b contains the target prices for 2002, statutory reference prices for 2019 and 2025, and economic cost per trend output unit for these years. Congress replaced upland cotton with seed cotton in the 2018 and 2025 Farm Bills. California grows mostly Temperate Japonica rice, but rest of the US grows mostly long grain rice. Their reference prices have differed since the 2014 Farm Bill. Cost of rice in this article is US cost excluding California while support prices and trend yields are for US long grain rice. Rice is referred to as “long grain rice” hereafter in the main body of this article.
Corn, Soybeans, Wheat
These are the largest acreage program crops. Relative to economic cost per trend output unit (hereafter “cost”), the 2025 statutory reference price for corn is lower than the 2019 statutory reference price. For soybeans and wheat, the 2025 and 2019 statutory reference prices are similar. Compared with the 2002 target price relative to cost, the 2025 statutory reference price relative to cost is 22 pp (percentage points) lower for corn (86% vs.108%), 17 pp lower for soybeans (83% vs. 100%), and 9 pp lower for wheat (82% vs 91%). Moreover, unlike 2002 target prices, 2025 statutory reference prices are clearly below the economic cost to produce all three crops.

Barley, Oats, Sorghum
These crops are often labelled “minor US feed grains.” For all three crops, support relative to cost is lower in 2025 than 2019 (see Figure 2). Compared with 2002, support to cost is lower for oats and sorghum but higher for barley. Among all the crops in this article, barley has the largest increase in support relative to cost while oats has consistently had the lowest support relative to cost. It is unclear why support to cost is so low for oats or increased the most for barley in this century.

Cotton, Peanuts, Long Grain Rice
These crops are often labelled “southern program crops.” Their support price to cost is similar to slightly lower for 2025 than 2019 (see Figure 3). 2025 support price to cost is notably lower for peanuts and long grain rice but slightly higher for cotton than 2002 support price to cost. Support price to cost has consistently been higher for peanuts and long grain rice than for the other crops in this article. The same is true for seed cotton since its inclusion in the 2018 Farm Bill. These differences will likely continue to fuel concerns about crop and regional inequity in US commodity programs.

Discussion
Higher statutory reference prices are a defining feature of the 2025 Farm Bill. The increases range from 10% for barley and oats to 21% for long and medium grain rice. A central argument by supporters of higher reference prices was higher cost of production.
Relative to economic cost of production per trend output unit, statutory reference prices average 3 pp (percentage points) lower for the 2025 than 2019 crop year. The range is -9 pp for sorghum to +2 pp for wheat.
Moreover, relative to cost, the 2025 statutory reference prices average 9 pp lower than the target prices authorized for the 2002 crop year. Declines occurred for seven of the nine USDA cost of production crops, ranging from -8 pp for long grain rice to -22 pp for corn and oats. The two exceptions are cotton / seed cotton (+3 pp) and barley (+18 pp).
The preceding comparisons imply that the increases in 2025 Farm Bill statutory reference prices are not out of line, even somewhat less than the changes in US cost of crop production that have occurred so far in the 21st Century.
A further implication is that, while the higher 2025 statutory reference prices will likely provide limited incentive for further increases in cost of production, they will also likely minimize any declines in the cost of production that future supply and demand may imply should happen.
Data Note: Data and Analysis
USDA, ERS computes an economic cost to produce barley, corn, cotton, oats, peanuts, rice, sorghum, soybeans, and wheat. ERS economic costs include operating costs, such as seed and fertilizer, and allocated overhead costs, such as equipment, taxes, and insurance. ERS assigns unpaid labor and farmer-owned land an opportunity cost. Only management is not assigned a cost. Quantity of an input is based on periodic surveys of farms. Price of an input is updated annually using USDA, NASS (National Agriculture Statistical Service) data. For a more detailed discussion of ERS costs, see Zulauf, Langemeier, and Schnitkey (2022).
Economic cost for 2025 is a preliminary estimate. It is only for the US and not available by region. The US all rice cost estimate for 2025 ($1,306/acre) is multiplied by 91.6%, the ratio of average per acre cost for Arkansas non-Delta, Gulf Coast, and Mississippi River Delta regions to the US all rice average per acre cost for the 2024 crop year.
Yields per harvested acre used to estimate trend yields are from QuickStats, a data base maintained by USDA, NASS. Change in yield over time is similar for harvested and planted acres. A linear time trend explained the following share of year-to-year variation in US yield per harvested acre over 1974-2024 by crop: barley (81%); corn (88%), upland cotton (83%), seed cotton (70%), oats (59%), peanuts (71%), rice excluding California (94%), sorghum (12%), soybeans (90%), and wheat (82%).
Source for the support prices used in this article is the farm bill for the given year. All farm bills except the 2025 Farm Bill are available at the University of Arkansas National Agricultural Law Center. For the 2025 Farm Bill, see US 119th Congress.

References and Data Sources
University of Arkansas National Agricultural Law Center. July 2025. United States Farm Bills. https://nationalaglawcenter.org/farmbills/
US 119th Congress. H.R. 1 – One Big Beautiful Bill. CONGRESS.GOV. https://www.congress.gov/bill/119th-congress/house-bill/1.
US Department of Agriculture, Economic Research Service. July 2025. Cost of Production. https://www.ers.usda.gov/data-products/commodity-costs-and-returns/
US Department of Agriculture, National Agricultural Statistics Service. July 2025. QuickStats. http://quickstats.nass.U.S.da.gov/
Zulauf, Carl, Michael Langemeier, and Gary Schnitkey. “U.S. Crop Profitability and Farm Safety Net Payments Since 1975.” Journal of ASFMRA, 2022, 60–69. https://www.jstor.org/stable/27224650.
Disclaimer: We request all readers, electronic media and others follow our citation guidelines when re-posting articles from farmdoc daily. Guidelines are available here. The farmdoc daily website falls under University of Illinois copyright and intellectual property rights. For a detailed statement, please see the University of Illinois Copyright Information and Policies here.