


Examining Working Capital Trends in 2024 Amid Lower Net Farm Incomes
Today’s article examines the liquidity of grain farms in Illinois. Liquidity refers to a farm business’s ability to generate sufficient cash or to quickly convert assets into cash to meet its financial obligations as they come due, including operational expenses, debt payments, family living expenses, and taxes. Using data from the Illinois Farm Business Farm Management (FBFM), our analysis focuses on annual trends in the median working capital to gross farm returns ratio for grain farms. This ratio measures a farm’s working capital relative to its operational size (gross farm returns).
Working capital is defined as the difference between current assets (i.e., cash and assets expected to be converted into cash within the next 12 months, including accounts receivable, inventory, and prepaid expenses) and current liabilities (i.e., obligations due within the next 12 months, such as accounts payable, short-term loans, and upcoming taxes). Gross farm returns are defined as the total value of agricultural output, including government farm program payments, and changes in inventory and account receivables. A farm with a working capital to gross farm returns ratio of 0.60 means that it has enough “cash” to replace 60% of gross farm returns in that year.
To evaluate the financial quality of the median ratio, we make use of the Center for Farm Financial Management’s Farm Financial Scorecard. A farm with a working capital to gross farm returns ratio that is less than 0.1 is categorized as vulnerable, a ratio between 0.1 and 0.3 is categorized as cautionary, and a ratio that is greater than 0.3 is categorized as strong. Therefore, the higher the ratio, the more liquid the farm is. Lastly, in our figures below, we use the color-coding system of the Farm Financial Scorecard to indicate the category under which the reported median ratio falls under. In our figure below, the region shaded in red indicates a vulnerable ratio, while yellow indicates a cautionary ratio, and green indicates a strong ratio. It is important to note that calculating the ratio from the median values in the bottom panel of the figure does not equate to the median reported ratio in the top panel. An example (for illustration purposes only) is provided in the appendix of this article.
Figure 1 shows the median values for current assets, current liabilities, working capital, gross farm returns, and the working capital to gross farm returns ratio for grain farms in Illinois from 2014 to 2024. The median ratio trended higher from 2019 to 2023, rising from 0.52 (strong) to 0.75 (strong), an increase of 43.86%. Over that same period, median working capital increased from $232,955 in 2019 to a peak of $584,939.50 in 2022 before declining the following year to $482,643.50. Despite the 2023 decline, this represents a 107.18% total increase for the period.
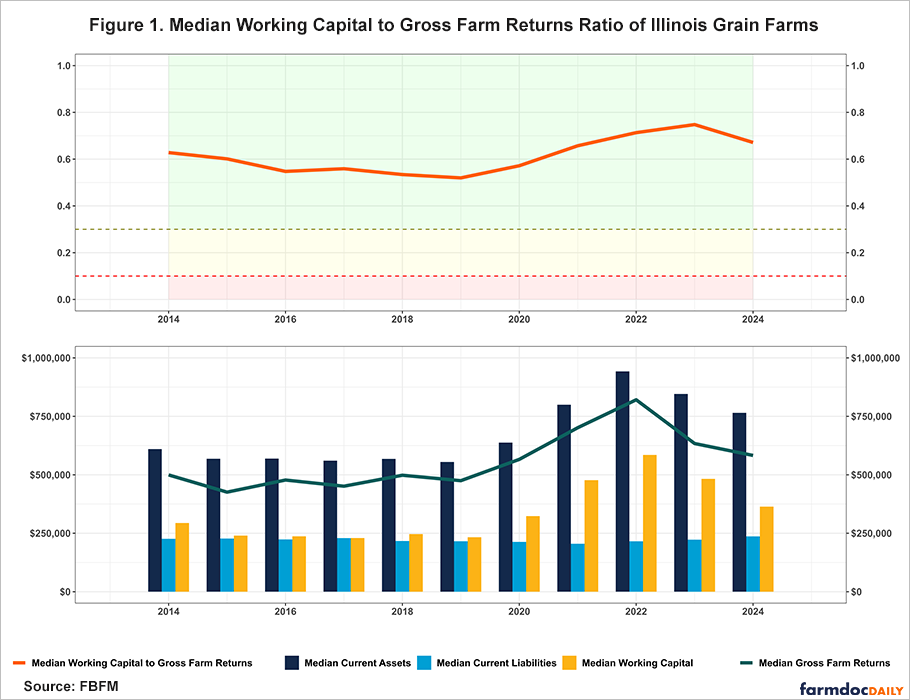
The rapid buildup in working capital was driven by current assets rising faster than current liabilities: median current assets rose by 52.43%, while median current liabilities rose by a modest 3.14%. The growth in current assets over this period was partly due to increases in grain prices, which helped drive median gross farm returns higher by 33.46%, resulting in higher ending inventory values. Additionally, these strong returns led to the highest income levels for Illinois grain farms in 2022, resulting in higher ending bank balances, allowing farmers to pay down longer-term debt, and reducing the need for operating lines of credit.
However, the median working capital to gross farm returns ratio declined in 2024 by 10.23%, falling to 0.67 (strong) from 0.75 (strong) the previous year. This year-over-year change was driven by declines in both of the ratio’s components, where median working capital fell by 24.58% while median gross farm returns fell by 8.04%. The drop in working capital was, in turn, a result of its components moving in opposite directions, where at the median, current assets fell by 9.56%, while current liabilities increased by 6.42%.
The 2024 decline in the median ratio is part of a broader trend since 2022. Median gross farm returns (as well as accrual net farm incomes) have been trending lower as grain prices have fallen, declining by 29% from $820,810.50 to $582,783.00 by 2024. As a result, ending inventory values have also declined, driving median current assets lower by 18.81% from $942,321.00 in 2022 to $765,052.00 by 2024. Over the same two-year period, median current liabilities rose by 9.83% as producers increased their use of short-term operating debt. Collectively, these factors drove a 37.77% decline in median working capital, which fell from $584,939.50 in 2022 to $363,996.00 in 2024.
Conclusion
Our analysis of Illinois grain farms reveals that liquidity, as measured by the working capital to gross farm returns ratio, remained strong at the median in 2024, despite declining by 10.23% from 0.75 (strong) the previous year to 0.67 (strong).
The recent negative trends in working capital and gross farm returns highlight the farm sector’s sensitivity to market conditions and its impact on the balance sheet and income statement. The buildup in working capital from 2019 to 2022 was partly driven by higher grain prices, which helped increase ending inventory values and allowed producers to reduce their reliance on short-term debt. Consequently, median current assets rose substantially over the period, increasing by 69.80%, while median current liabilities remained relatively unchanged. Conversely, as grain prices have fallen, along with higher input and borrowing costs, working capital and gross farm returns have trended lower.
While the median working capital to gross farm returns ratio was strong in 2024, its decline underscores the importance of continued liquidity monitoring as producers navigate challenging market conditions, uncertainty, and cost pressures. This is especially critical for the farms operating well below the median, as this recent decline may have pushed some of them into the vulnerable range.
Acknowledgment
The authors would like to acknowledge that data used in this study comes from the Illinois Farm Business Farm Management (FBFM) Association. Without Illinois FBFM, information as comprehensive and accurate as this would not be available for educational purposes. FBFM, which consists of 5,000+ farmers and 70 professional field staff, is a not-for-profit organization available to all farm operators in Illinois. FBFM field staff provide on-farm counsel along with recordkeeping, farm financial management, business entity planning and income tax management. For more information, please contact our office located on the campus of the University of Illinois in the Department of Agricultural and Consumer Economics at 217-333-8346 or visit the FBFM website at www.fbfm.org.
Appendices
Table 1 presents fictional data to illustrate why the median working capital to gross farm returns (WC to GFR) ratio (displayed in the top panel of Figure 1) differs from a ratio calculated by dividing median working capital by median gross farm returns (values shown in the bottom panel of Figure 1).
For example, suppose we have five producers. The first step is to calculate the WC to GFR ratio for each individual producer by dividing their working capital by their gross farm returns (column 6 of Table 1). Next, we find the median values for each metric (bottom row of Table 1). The median WC to GFR ratio—that is, the median of the individual producer ratios—is 0.56.
However, if we instead calculate the ratio using the median values from the bottom row (dividing median working capital by median gross farm returns), we obtain a value of 0.50, not 0.56. This demonstrates the difference between the "median of the ratios" (0.56) and the "ratio of the medians" (0.50).
The same logic applies to calculating median working capital. In Table 1, the true median working capital (the median of all producers) is $50,000. However, taking the difference between median current assets ($120,000) and median current liabilities ($65,000) results in a different value of $55,000, not $50,000.
Table 1. Example Data Reported for Illustration Purposes Only
| Reported Current Assets | Reported Current Liabilities | Reported Working Capital | Reported Gross Farm Returns | Reported WC to GFR Ratio | |
| Producer 1 | $100,000 | $50,000 | $50,000 | $100,000 | 0.50 |
| Producer 2 | $120,000 | $80,000 | $40,000 | $72,000 | 0.56 |
| Producer 3 | $200,000 | $50,000 | $150,000 | $195,000 | 0.77 |
| Producer 4 | $80,000 | $70,000 | $10,000 | $97,000 | 0.10 |
| Producer 5 | $190,000 | $65,000 | $125,000 | $180,000 | 0.69 |
| Median | $120,000 | $65,000 | $50,000 | $100,000 | 0.56 |
Disclaimer: We request all readers, electronic media and others follow our citation guidelines when re-posting articles from farmdoc daily. Guidelines are available here. The farmdoc daily website falls under University of Illinois copyright and intellectual property rights. For a detailed statement, please see the University of Illinois Copyright Information and Policies here.