Operational Ratios for Evaluating the Farm Business
As we begin to analyze the decisions that have already been made for 2024, we can use how the farm business performed in 2023 to help project 2024 outcomes. Various financial statements should have been completed for 2023, including an accrual income statement and balance sheet, to measure the profitability and net worth change of the business. From these two financial statements, a number of financial measures can be calculated to analyze the farming operation.
The Farm Financial Standards Council (FFSC) has published guidelines for measuring the financial efficiency of the farm business. There are four operating ratios they suggest to measure the relationship of expense and income categories to gross revenue. The four operational ratios are the operating expense, depreciation expense, interest expense and net farm income from operations ratios.
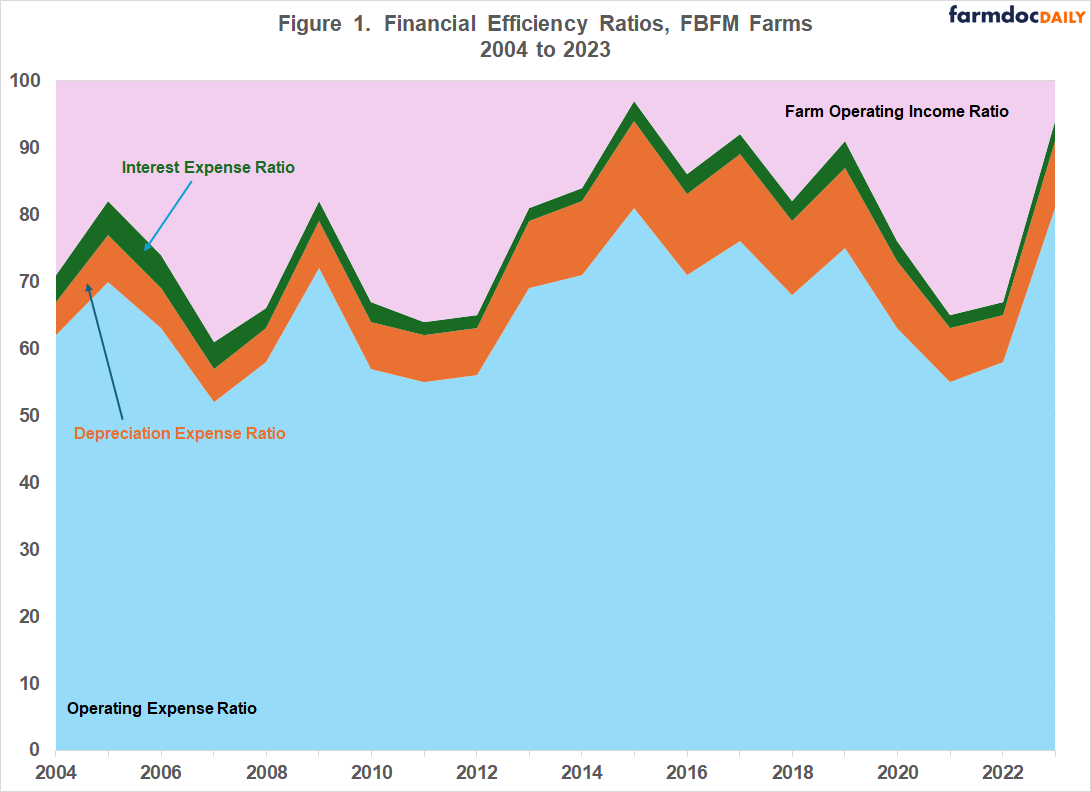
Using data from farms enrolled in Illinois Farm Business Farm Management (FBFM) financial studies, we will look at the range for these ratios from 2004 through 2023. Figure 1 shows the ranges of these ratios for this period and how they interact with each other.
Operating Expense Ratio
The operating expense ratio is calculated by dividing total operating expenses, not including depreciation and interest, by gross farm revenues. This ratio measures the farm’s efficiency in utilizing operating expenses in producing gross revenues. Over the last 20 years, Illinois farms have been in the 52 – 81 percent range with an average of 66 percent. That means a farm would have $52 to $81 of operating expenses for every $100 of gross revenue. When the operating expense ratio was 71% or more in this period, there was a decrease in the net farm income from operations of 17% or more and this happened six times in the last 20 years.
Depreciation Expense Ratio
The depreciation expense ratio is calculated by dividing farm depreciation by gross farm revenues. This ratio would vary among farms depending on the type of farm, the amount of capital purchases and the method of depreciation used. Illinois FBFM farms use economic depreciation that uses the Alternative Depreciation System (ADS) life with a 125 percent declining balance. The 20-year range for depreciation expense ratio for grain farms was 5 – 13 percent. The average for this same period was 9 percent.
Interest Expense Ratio
The interest expense ratio is calculated by dividing total farm interest expense by gross farm revenues. This measure is often used to evaluate the financial risk of a farm business. The higher this ratio the more financial risk the farm business has. An interest expense ratio of 2 – 5 percent was the range for the last 20 years for Illinois farms with an average of 3 percent. As this ratio approaches 10 percent or more, producers should monitor the financial health of their business very closely. In 2023, the average accrual net farm income was negative when this ratio was 10 percent or more.
Net Farm Income from Operations Ratio
The final operational ratio identified by the FFSC is the net farm income from operations ratio. This ratio is calculated by dividing net farm income from operations by gross farm revenues. Net farm income from operations does not include any gains or losses from the sale of capital assets, like machinery or land. This ratio can be used to get a handle on the size or volume a business needs to be to generate an adequate income to meet family living expenses. This ratio also varies by farm type. Farm operating income ratio for grain farms averaged 21 percent from 2004 to 2023 and ranged from 1 – 38 percent. For every $100 of gross revenues, these farms would generate about $21 on average of farm operating income.
Summary
When the four operational ratios are added together, they equal 100 percent. Therefore, if you estimate three of the ratios, you can also project the 4th ratio. If we increase the 2023 operating expense ratio four percent to 84 percent and add one percent to the 2023 depreciation and interest expense ratios (11 percent and 4 percent, respectively), then we get a projected net farm income from operations ratio of one percent. You can change these percentages throughout the year as expenses get paid and grain is marketed.
Calculating operational ratios is just one step in analyzing the financial health of your business. There are other financial measures that help producers evaluate their business. However, the key to calculating any of these measurements is to have complete and accurate financial statements, such as an accrual income statement and a balance sheet.
The author would like to acknowledge that data used in this study comes from Illinois Farm Business Farm Management (FBFM) Associations across the state. Without their cooperation, information as comprehensive and accurate as this would not be available for educational purposes. FBFM, which consists of 5,000 plus farmers and 65 plus professional field staff, is a not-for-profit organization available to all farm operators in Illinois. FBFM field staff provide on-farm counsel with recordkeeping, farm financial management, business entity planning and income tax management. For more information, please contact the State FBFM Office located at the University of Illinois Department of Agricultural and Consumer Economics at 217-333-8346 or visit the FBFM website at www.fbfm.org.
Disclaimer: We request all readers, electronic media and others follow our citation guidelines when re-posting articles from farmdoc daily. Guidelines are available here. The farmdoc daily website falls under University of Illinois copyright and intellectual property rights. For a detailed statement, please see the University of Illinois Copyright Information and Policies here.


