


Agricultural Land Lost to Development in the Midwest
Conversion of agricultural land to developed land during the 21st Century in eight Midwestern states is examined. This loss of agricultural land to development is a long-standing topic of discussion at the national and state level. Using what is likely the best available data set, we find that development accounted for 55% of the 1.6 million acre loss of agricultural land in these states during the 21st Century. Thus, while urban expansion is important, loss of agricultural land is more than development. Within the context of conversion to development, the role of large urban areas is paramount as 81% of agricultural land lost to development in the eight states occurred within Metropolitan Statistical Areas (MSAs). If a desire exists to reduce the loss of agricultural land to development, expansion of large urban areas must be addressed.
Data Sources
The National Land Cover Database (NLCD), produced by the Multi-Resolution Land Characteristics (MRLC) consortium, has leading-edge capabilities for assessing and projecting changes in land cover. The current analysis uses two satellite images and other supplementary cartographic datasets to analyze land use change from 2001 to 2021 in the Midwestern states of Illinois, Indiana, Iowa, Michigan, Minnesota, Missouri, Ohio, and Wisconsin. The analysis period is the earliest to the latest years in the dataset. A wide variety of land conversions can be studied. In this article, we focus solely on the conversion of agricultural to developed land. Data Note 1 contains a detailed description of the definitions of these land categories.
Agricultural Land Lost to Development by Midwestern State
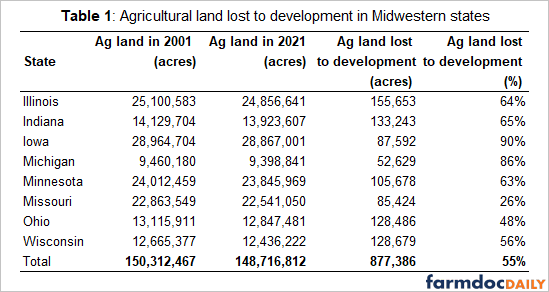
According to NLCD images from 2001 and 2021, agricultural land in the eight Midwestern states decreased from 150,312,467 acres in 2001 to 148,716,812 acres in 2021, a total decline of 1,595,655 acres (1.06%) (Table 1). Of the agricultural land lost, 877,386 acres (55% of 1,595,655) were converted into developed land, likely due to urbanization, infrastructure expansion, or other development activities. Other agricultural land losses included conversion to forest, barren land, open water, and grassland.
Conversion to development was most important in Iowa. Development accounted for 90% of the loss of agricultural land in Iowa between 2001 and 2021 (see Table 1). Conversion to development accounted for the smallest of agricultural land loss in Wisconsin, Ohio, and Missouri. Development’s share of total agricultural land lost was 56%, 48%, and 26%, respectively. When measured as number of acres, Illinois had the highest amount of agricultural land lost to development (155,653 acres), followed by Indiana (133,243 acres) and Wisconsin (128,679 acres). Michigan, Missouri, and Iowa lost the least number of agricultural acres to development at 52,629, 85,424, and 87,592, respectively.
Agricultural land lost to development by Metropolitan Statistical Areas (MSAs)
To help understand the dynamics of the agricultural land use change and aid in regional planning and development, an analysis was carried out at the Metropolitan Statistical Area (MSA) level. The Office of Management and Budget (OMB) defines an MSA as a geographical region consisting of a core city with “a population of at least 50,000” and maintaining strong economic and social interactions between the core city and the surrounding communities. The eight Midwestern states have 85 MSAs in total.
Of the agricultural land in the Midwestern states lost to development over the last two decades, 81% has occurred within MSAs. The share was highest in Illinois (89%) (Figure 1). Indiana, Michigan, Minnesota, and Wisconsin also lost over 80% of their agricultural land to development within MSAs. The MSA share was lowest in Iowa at 69%. The share for both Missouri and Ohio was 77%.
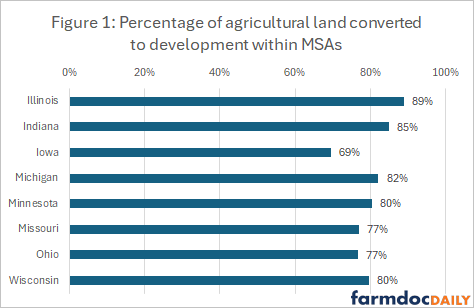
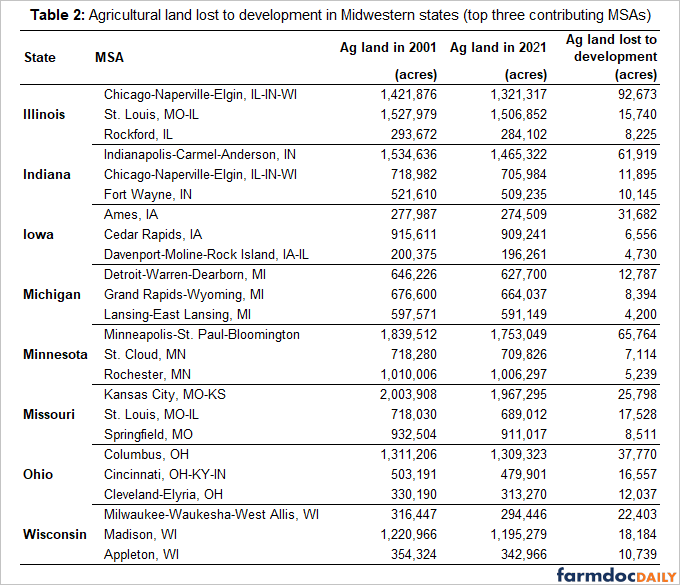
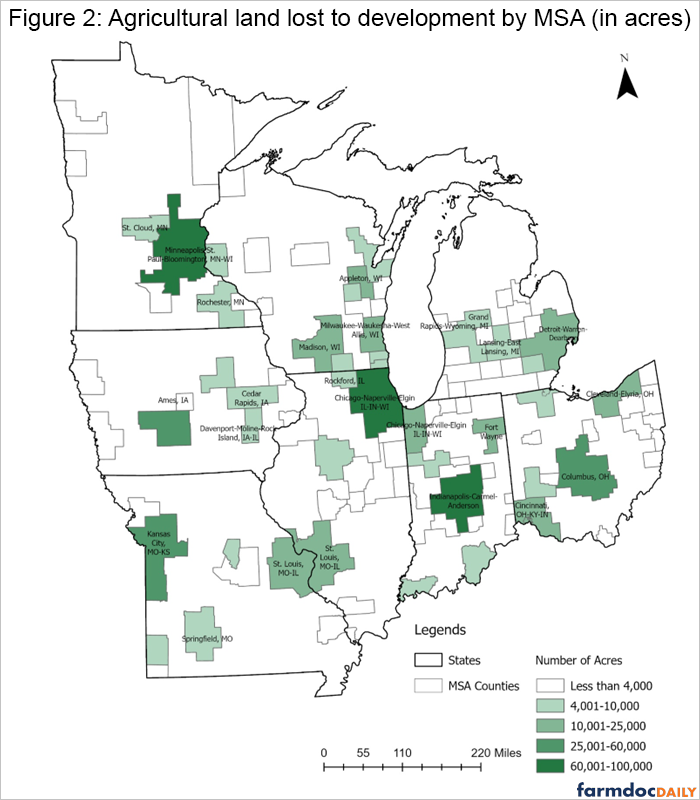
Table 2 lists for each state its three MSAs in which the most agricultural land was converted into developed land within that state. Among the 24 MSAs, the highest number of acres converted from agricultural to developed land was the Chicago-Naperville-Elgin MSA, with 92,673 acres converted. This MSA spans the northern part of Illinois, parts of Indiana, and southeastern Wisconsin (see Figure 2). The MSA with the second highest loss of agricultural land to development was the Minnesota MSA of Minneapolis-St. Paul-Bloomington at 65,754 acres, followed by the Indiana MSA of Indianapolis-Carmel-Anderson MSA at 61,919 acres.
Agricultural Land Lost to Development by County
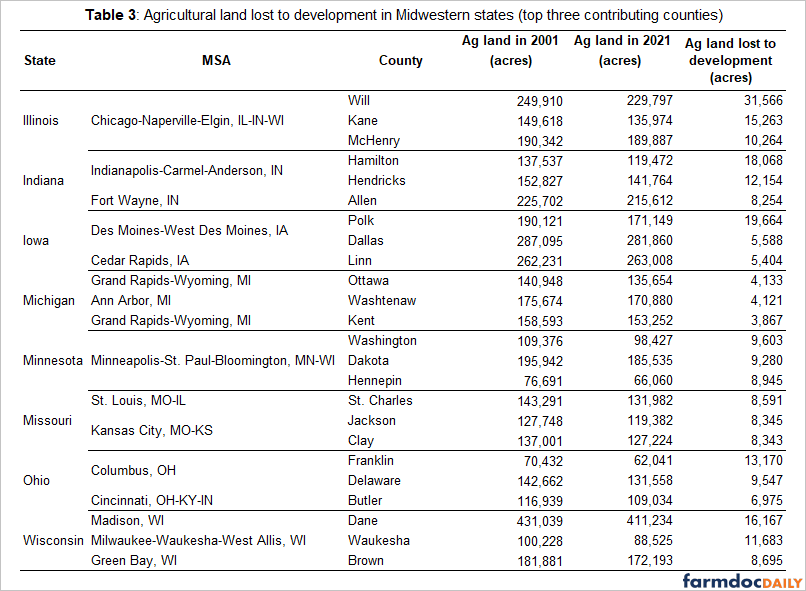
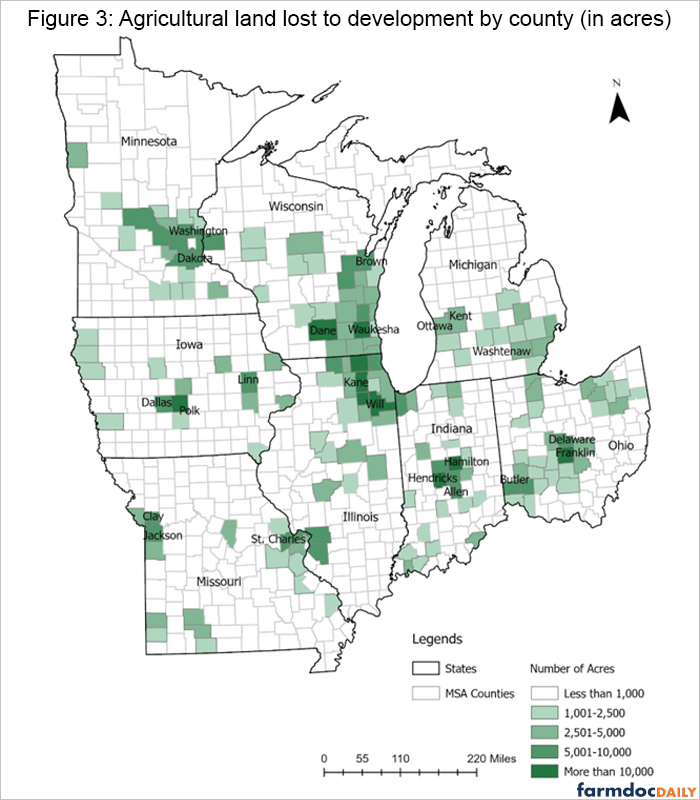
Next, we consider agricultural land lost to development by county between 2001 and 2021. Table 3 presents the top 3 counties in each state with the highest number of acres of agricultural land converted to development while Figure 3 presents a visual picture of each county in the eight Midwestern states.
Will County (part of the Chicago-Naperville-Elgin MSA) had the largest amount of agricultural land converted to development at 31,566 acres. This was 20% of the total ag-to-development conversion for the state of Illinois. The next highest county was Polk County, part of Iowa’s Des Moines-West Des Moines MSA, which lost 19,664 acres. Third highest loss was 18,068 acres in Hamilton County within Indiana’s Indianapolis-Carmel-Anderson MSA.
Summary
Between 2001 and 2021, agricultural land in the eight Midwestern states decreased by 1,595,655 acres (1.06% of total agricultural land in 2001). Conversion to developed land accounted for 877,386 acres (about 55%) of this loss, likely from urbanization and infrastructure expansion. Thus, while the role of urbanization is important, other factors are also at play and need to be examined to fully understand the loss of agricultural land.
Iowa had the highest proportion (90%) of its lost agricultural land converted into developed land, while Illinois had the greatest loss in acres (155,653). Large urban areas play a paramount role as 81% of agricultural land lost to development in the eight states occurred within Metropolitan Statistical Areas (MSAs). If a desire exists to reduce the loss of agricultural land to development, it must address the expansion of large urban areas.
Data Note 1
According to NLCD, agricultural land is defined as any area designated as cultivated cropland or pasture/hay. Cultivated cropland includes perennial woody crops such as orchards and vineyards. Pasture/Hay are areas of grasses, legumes, or grass-legume mixtures planted for livestock grazing or the production of seed or hay crops, typically on a perennial cycle. By definition, within each land observation, cultivated cropland or pasture/hay vegetation accounts for more than 20% of total vegetation.
Developed land is composed of these categories: (a) developed open space, (b) developed low intensity, (c) developed medium intensity, and (d) developed high intensity. Developed open spaces consist of some constructed materials but are mainly covered with vegetation, such as lawn grasses, with less than 20% of the area being impervious surfaces. These areas include large-lot single-family homes, parks, golf courses, and vegetation used for recreation, erosion control, or aesthetic purposes. Developed low-intensity areas contain a mix of built materials and vegetation, with 20% to 49% of the area being impervious surfaces, typically including single-family homes. Developed medium-intensity areas, where impervious surfaces cover 50% to 79% of the area, also primarily consist of single-family homes. Developed high-intensity areas have 80% to 100% impervious surfaces and are characterized by dense human habitation or commercial/industrial activities, such as apartment complexes, row houses, and commercial or industrial zones. For additional discussion, visit National Land Cover Database Class Legend and Description | Multi-Resolution Land Characteristics (MRLC) Consortium
References
Multi-Resolution Land Characteristics Consortium. (2021). National Land Cover Database class legend and description. Retrieved from NLCD 2021 Land Cover (CONUS) | Multi-Resolution Land Characteristics (MRLC) Consortium
Disclaimer: We request all readers, electronic media and others follow our citation guidelines when re-posting articles from farmdoc daily. Guidelines are available here. The farmdoc daily website falls under University of Illinois copyright and intellectual property rights. For a detailed statement, please see the University of Illinois Copyright Information and Policies here.