Machinery Costs on Illinois Grain Farms
Machinery costs on Illinois grain farms have increased through time. Costs increase more rapidly during high income periods as producers make machinery investments and manage their taxable income. The current, low-return environment has farm businesses seeking cost reduction strategies. Appropriately sizing the operation’s machinery complement and delaying unnecessary capital purchases will help preserve financial resources during low return periods. Lower per acre power costs are also positively associated with more profitable farms. But, machinery cost management is a continuous process, not a one-and-done decision.
Machinery Costs through Time
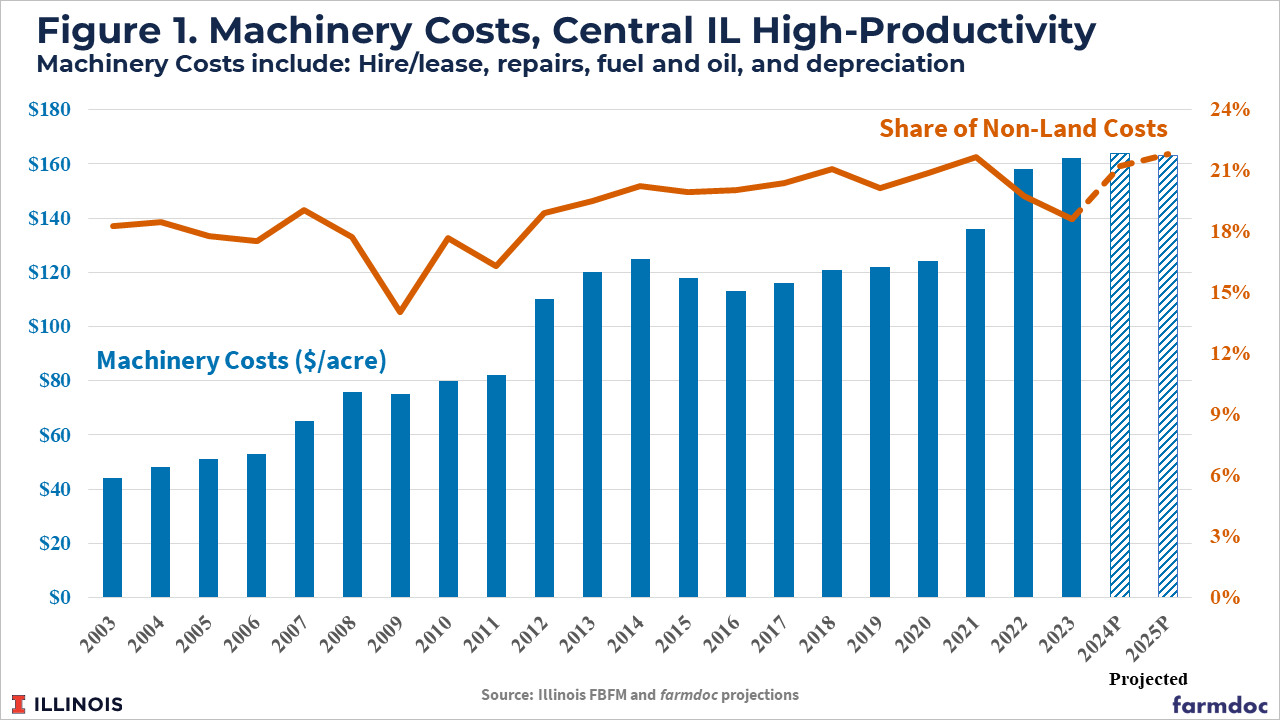
University of Illinois crop budgets and historical returns, which rely on information from cooperating farmer members of Illinois Farm Business Farm Management (FBFM), include a power cost category which has components associated with a farm’s machinery and equipment. In today’s article we use a subset of power costs that we define as machinery costs. Machinery costs reported here include machinery hire and lease, repairs, fuel and oil, and economic depreciation. Figure 1 shows average machinery costs per acre for corn production on FBFM grain farms in central Illinois from 2003 through 2023, with current projections for 2024 and 2025.
Machinery costs on corn acres have increased over time, from $44 per acre in 2003 to $162 per acre in 2023. The rate of increase in machinery costs follows returns. Costs increased more rapidly during the high return period from the mid-2000s through 2014 and the more recent high return years from 2020 to 2022. Machinery costs have also increased in terms of their share of total land costs. Machinery costs averaged 17.7% of total non-land costs from 2003 to 2013. This share increased to 20.2% from 2014 to 2023.
Machinery Cost Categories
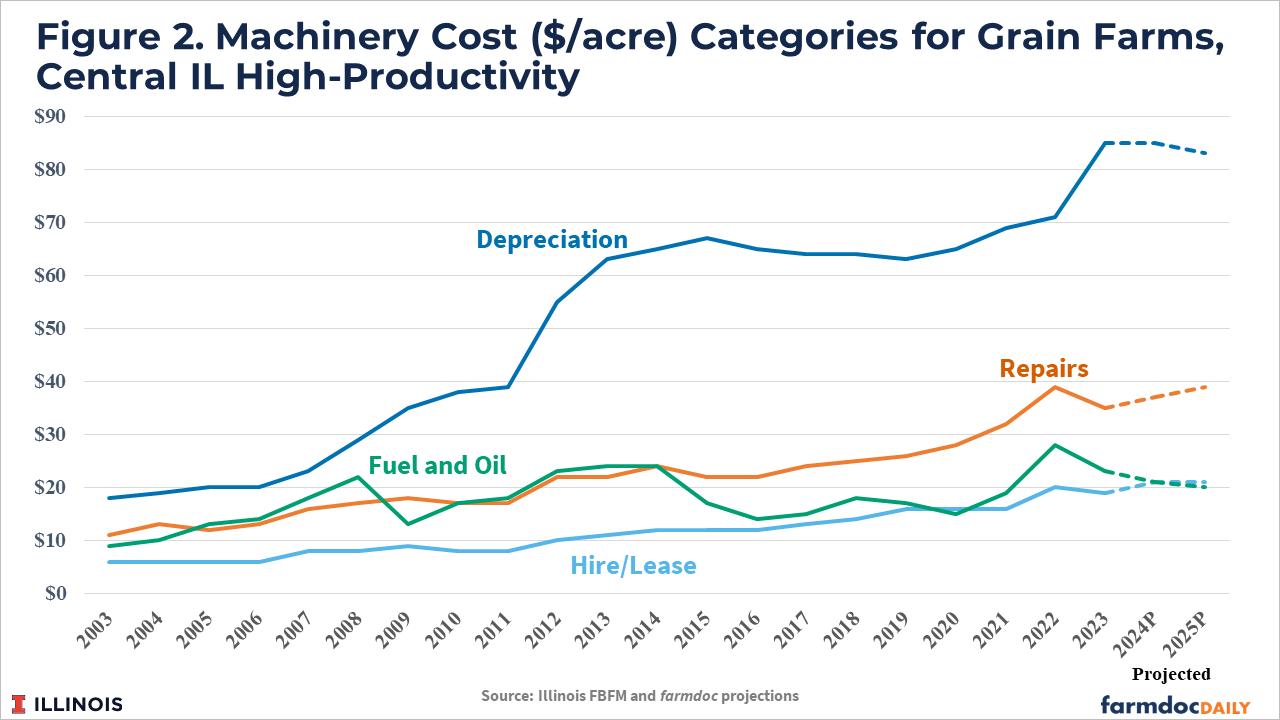
Figure 2 plots the repairs, hire and lease, fuel and oil, and depreciation components of machinery costs. All individual cost categories have increased since 2003. Repairs and hire and lease costs have followed a fairly stable upward trend through time, with slightly larger rates of increase since 2020.
Fuel and oil costs have also trended up but have shown both annual increases and decreases reflecting the variability in energy prices.
Since 2003, FBFM has used economic depreciation, in most cases calculated with the 125% declining balance method assuming a 10-year useful life and no salvage value (see farmdoc daily article from March 19, 2021). Thus, changes in depreciation costs over time are directly linked with the capital purchases made by farmers. Purchases of machinery will increase depreciation costs, and those increases will persist for multiple years.
Depreciation costs on FBFM farms increased more rapidly from the mid-2000s through 2015. This resulted from larger capital purchases driven by higher farm incomes and changes to the tax code that allowed more of the machinery purchase price to be deducted in the year of purchase.
From 2015 to 2019, depreciation costs flattened out as capital purchases were reduced during the lower income years. Depreciation costs then increased at a faster rate again during the higher income years from 2020 to 2023.
USDA Prices Paid Indexes
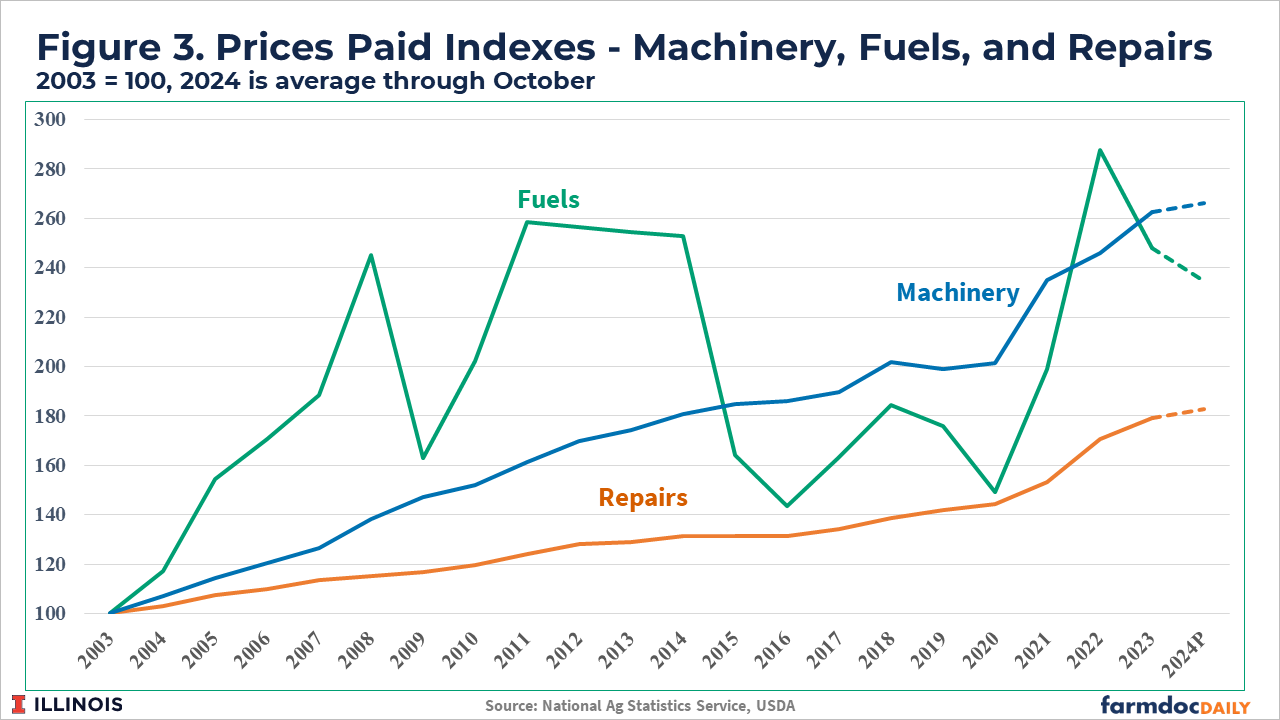
Figure 3 shows the prices paid indices for machinery, fuels, and repairs as reported by the USDA. Each price index is normalized to 2003 (i.e. value is 100 for all three indices in 2003).
The fuels price index further illustrates the variability in energy prices over time. As of 2023, fuel prices have increased to more than 2.4 times their levels in 2003. However, per acre costs have roughly doubled (see Figure 2), indicating gains in fuel efficiency for farm machinery over time.
Prices for repair services have increased by a factor of 1.8 since 2003, with a more rapid rate of increase noticeable since 2020. The compound annual growth rate (CAGR) in the repairs price index is 3% for 2003 to 2023, while it is 7% for 2020 to 2023.
Machinery prices have increased by a factor of 2.6 since 2003 and have also increased more rapidly since 2020. The CAGR for machinery prices since 2003 is 5%, while it is 9% since 2020.
The increase in the repairs and machinery price indices since 2003 is smaller than the relative cost increases for repairs and depreciation over the same time period shown in Figure 2, suggesting that machinery purchases and hired repair services have increased in both volume and price. This is consistent with trends towards larger and more technologically advanced equipment that requires skilled labor to repair and maintain.
Discussion
Producers are facing much lower return prospects for 2024 and 2025 as commodity prices have declined and costs remain elevated. Identifying strategies to reduce production costs will be critical to successfully managing through the current low-income period. Reductions and delays in capital purchases can lead to lower depreciation costs but will take time.
Repair costs have increased consistently through time. This trend does not seem likely to change given the increased complexity of modern farm machinery and the skilled labor of repair technicians.
Power and machinery costs have been shown to vary substantially across farm profitability groups (see farmdoc daily article from July 21, 2023), with more profitable farms having lower power costs and vice versa. Cost-efficient farms have machinery complements that are appropriately sized for their operations. Delaying unnecessary capital purchases is advised to preserve financial resources during periods of low returns (see farmdoc daily article from October 8, 2024).
Acknowledgement
The authors would like to acknowledge that data used in this study comes from the Illinois Farm Business Farm Management (FBFM) Association. Without Illinois FBFM, information as comprehensive and accurate as this would not be available for educational purposes. FBFM, which consists of 5,000+ farmers and 70 professional field staff, is a not-for-profit organization available to all farm operators in Illinois. FBFM field staff provide on-farm counsel along with recordkeeping, farm financial management, business entity planning and income tax management. For more information, please contact our office located on the campus of the University of Illinois in the Department of Agricultural and Consumer Economics at 217-333-8346 or visit the FBFM website at www.fbfm.org.
References
Schnitkey, G., N. Paulson, B. Zwilling, B. Goodrich, C. Zulauf and J. Baltz. "Perspectives and Strategies for Dealing with Low Farm Incomes in 2024 and Beyond." farmdoc daily (14):183, Department of Agricultural and Consumer Economics, University of Illinois at Urbana-Champaign, October 8, 2024.
Zwilling, B. "The Characteristics of Higher Profit Farms in Illinois, 2013 – 2022 Average." farmdoc daily (13):135, Department of Agricultural and Consumer Economics, University of Illinois at Urbana-Champaign, July 21, 2023.
Zwilling, B. "The Impact of Power and Equipment Costs on Illinois Grain Farms." farmdoc daily (11):42, Department of Agricultural and Consumer Economics, University of Illinois at Urbana-Champaign, March 19, 2021.
Disclaimer: We request all readers, electronic media and others follow our citation guidelines when re-posting articles from farmdoc daily. Guidelines are available here. The farmdoc daily website falls under University of Illinois copyright and intellectual property rights. For a detailed statement, please see the University of Illinois Copyright Information and Policies here.


