Risk Management and Reality: Farmers’ Use of Futures Markets
Note: This article was written by University of Illinois Agricultural and Consumer Economics Ph.D. student Aayush Raj Dhakal and edited by Joe Janzen. It is one of several excellent articles written by graduate students in Prof. Janzen’s ACE 527 class in advanced agricultural price analysis this fall.
Futures and options markets are often presented as a vital tool for farmers to hedge price risks associated with crop production. The textbook example is a corn farmer who offsets the risk of price declines for his or her growing crop by selling a corn futures contract at planting and buying it back at harvest. Gains or losses in the value of the crop over this period are offset by corresponding losses or gains in the value of the futures position, allowing the farmer to ‘lock in’ prices ahead of the harvest. But how commonly do farmers actually use futures and options as a marketing tool?
In this article, we assess the use of futures markets among farmers. Using a basic definition of active futures use observable in farm financial data, the existence of an active futures brokerage account with a non-zero balance, we find only about 15% of Illinois grain farms use futures. This proportion is slightly higher than rates found in national data. We find futures use somewhat more prevalent among larger farms, but most farms in all size categories do not use futures and options directly.
To consider whether futures use matters, we compare marketing outcomes for farmers with active hedging accounts to those who do not. Among these two groups, average prices received are not significantly different and the range of price outcomes is roughly similar. Our results suggest that while futures markets are an important mechanism for price discovery for agricultural commodities and a useful risk management tool for many firms, these more ‘sophisticated’ marketing tools do not necessarily lead to success in commodity marketing.
How Many Farmers Use Futures?
We use farm financial data from Illinois FBFM to see grain farmers in Illinois, particularly those growing corn and soybeans, who maintain active hedging accounts. While these farms may not use futures or options for hedging in any specific situation, having a brokerage account is a necessary condition to employ to use futures sales, put options purchases, or any other more complex farm marketing risk management strategy.
Data for Illinois grain farms may shed additional light on how farmers interact with futures markets. It is well known that many farmers do not use the futures market. Prager et al. (2020) found that only about 2% of all U.S. farms used futures or options contracts in 2016. Corn and soybean farmers were more active users of futures. Of those farms that did use futures and options contracts, around 90% were corn and soybean farmers. Despite this higher concentration among these crops, only about 12% of all US corn farms and about 11% of all US soybean farms used futures or options.

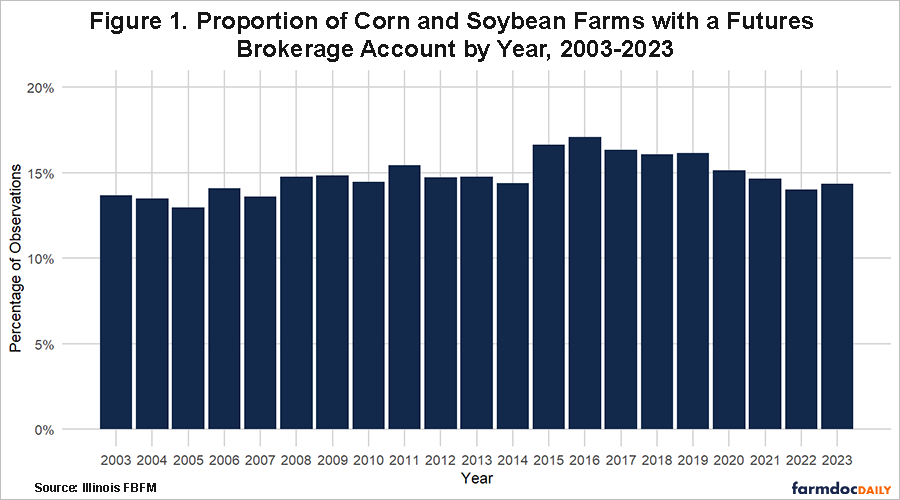
We find the proportion of farms with futures brokerage accounts among grain farms in Illinois is slightly higher than the national average level of futures and options use for corn and soybean farms reported by Prager et. al. (2020). Figure 1 displays the percentage of farmers with non-zero hedging account balances from 2003 to 2023, showing that the proportion of farmers using futures fluctuated between 13% and 17% over this period. While this figure fluctuates from year to year – mainly due to changes in the composition of farms in the FBFM dataset – there is no clear upward trend, indicating that the usage has remained relatively stable. However, the difference is not substantial when compared to the national average, suggesting that Illinois farmers are not significantly more inclined to use futures as a risk management tool.
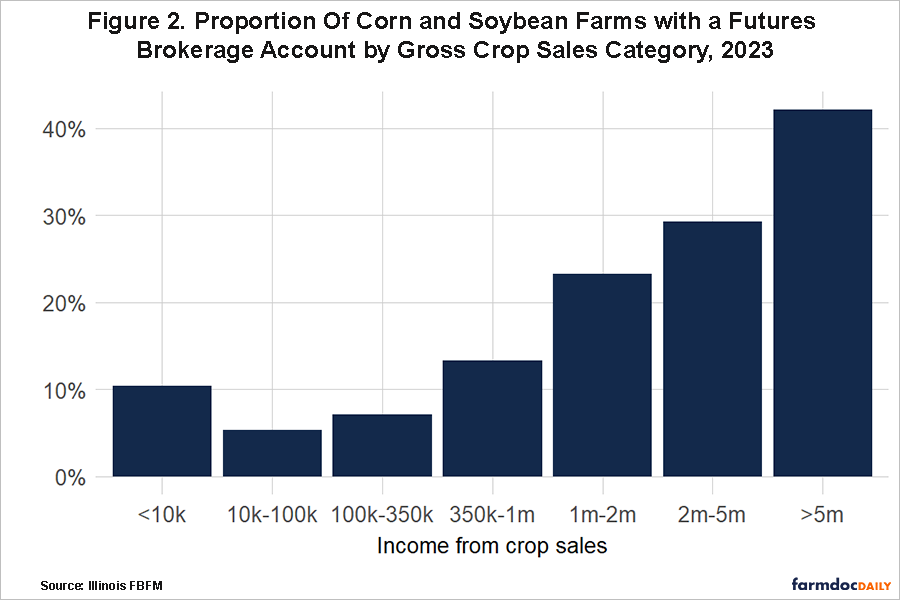
The slightly higher adoption rate in Illinois may be attributed to a higher concentration of commercial corn and soybean farms in Illinois. Similar to Prager, et al. (2020), we see that large farms are more likely to use futures. Figure 2 categorizes farmers into seven distinct groups based on crop sales revenue in 2023. This figure illustrates the proportion of farmers within each category who adopt the futures market for risk management. 23% of farms with gross crop sales between $1-2 million are futures and options users and this figure grows to more than 40% for the small number of farms with sales greater than $5 million. In all groups, the majority of farms do not have a futures brokerage account.
Do Farmers Using Futures Get Better Prices?
We do not observe corn or soybean sales or futures and options trades directly in the FBFM data, so we cannot directly analyze marketing activity. We do observe two broad measures of overall marketing performance, the new-crop and old-crop sales prices for each marketing year. The new-crop price is the average price received for corn and soybean sales from September 1 to December 31. The old-crop price is the average price received for corn and soybean sales from January 1 to August 31, which we call the old-crop period.
To assess the relationship between futures use and marketing performance, we compare the average price received between farms with and without futures brokerage accounts. Farms with brokerage accounts have access to additional marketing strategies that those without do not. In addition, farms with futures may better informed about market dynamics and strategies than their peers. In either case, we might expect farmers with futures to outperform those who do not use them.
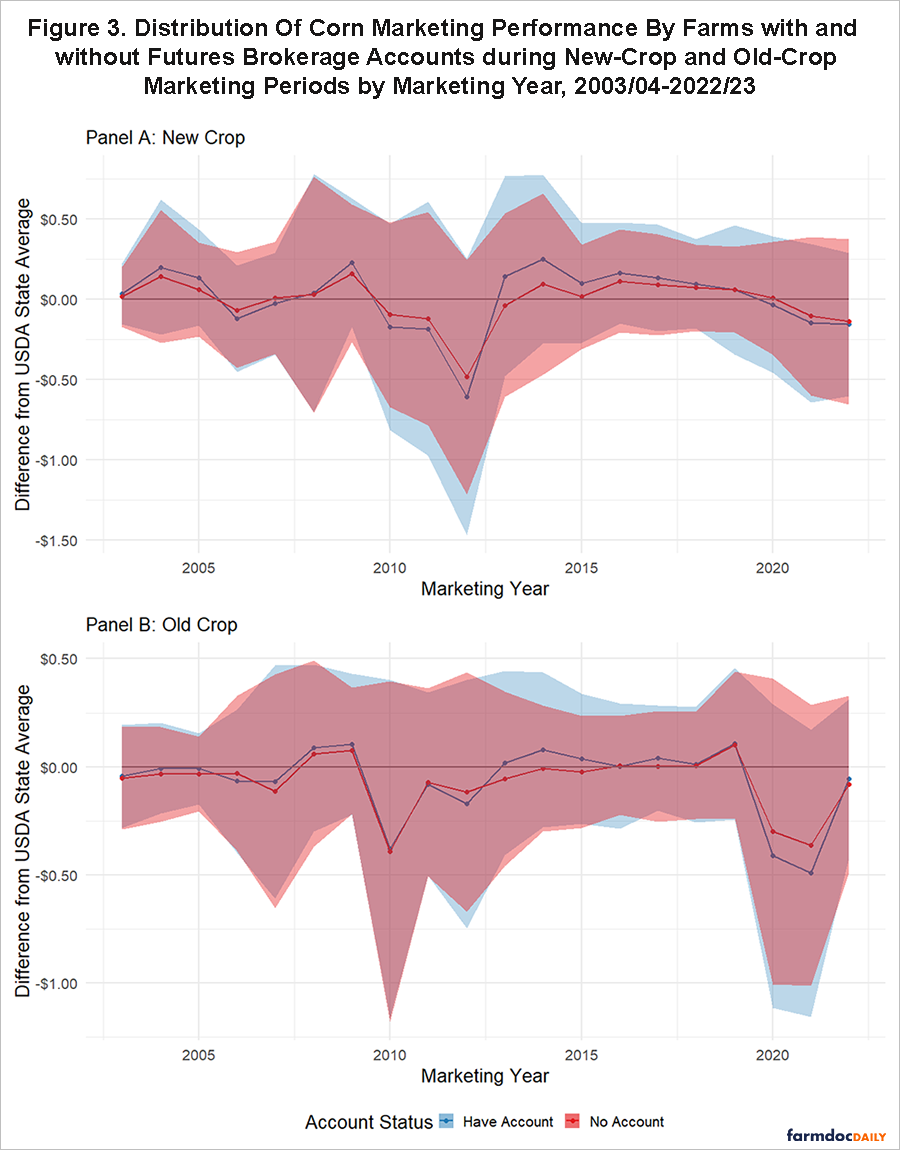
Figure 3 presents the results of this comparison between futures- and non-futures-using farms for new-crop and old-crop prices, respectively. We show the mean and distribution of prices received for corn for each group by year. The shaded range represents the mean, plus and minus one standard deviation. To adjust for changing price levels over time, we consider the difference between the price received by an individual farm and the USDA-reported average price received for farms in Illinois during the new-crop and old-crop time periods in that year. This adjustment allows us to compare marketing performance across years by recognizing the fact that all farms receive higher prices in high price years and lower prices in low price years.
We find that the average prices and the range of prices received by the two groups are quite similar in both periods. The similar average values and overlapping ranges for prices received suggest farmers with futures have no consistent advantage in securing better prices for corn. While not shown here, this result holds similarly for soybean sales.
To account for variation in marketing performance between different years, we categorize years based on price movements in the December corn futures contract from May to October, the main growing season for corn in Illinois. If the December futures price in October is higher than in May, we label this as a rising price year. Conversely, if the price is higher in May and declines by October, it is a falling price year. We then compare new-crop prices received between years where prices rose leading up to harvest to those where it fell. We might expect farms with futures to be more proactive price risk managers and thus outperform their peers in falling price situations where active risk management is especially valuable.
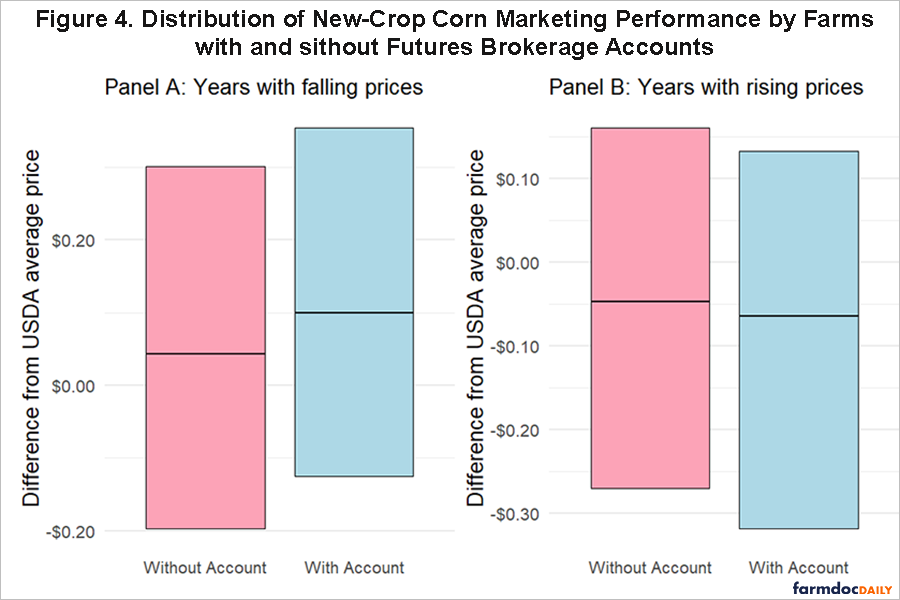
Figure 4 illustrates the distribution of new-crop corn prices received by farmers in these two scenarios. The middle line in each bar is the median difference between the farm-specific price received for all farm level observations in our data in a particular type of year. The height of the bars represents the range of outcomes as given by the interquartile range. Panel A shows the distribution for falling price years, while Panel B displays it for rising price years. Again, most farms in most years are near the USDA reported average price received, so the difference is near zero.
In years when prices fell from May to October, we observe a very small positive difference in the distribution of prices received by farmers who used futures compared to those who did not. During falling price years, farmers with futures accounts received a median price five cents per bushel higher than farmers without futures accounts. In rising price years, they received a median price one cents per bushel lower. In both cases, the distributions exhibit strong overlap, suggesting these differences are not economically or statistically significant.
Discussion
We find about 15% of Illinois grain farmers have futures brokerage accounts and thus can use futures and options markets as part of their grain marketing activity. We might expect these farmers to be savvier marketers who better manage price risk. However, these farms do not outperform those who do not use futures and options strategies; the data reveal that the average prices received by both groups are not significantly different. Further, the distribution of prices highlights the variability of marketing outcomes across time and among farms. We do see that farmers with futures accounts tend to receive slightly better prices in periods where prices are falling, but these differences are marginal and not necessarily statistically significant.
A key limitation of our analysis is the limited data on marketing performance, which prevents us from accurately identifying the sales timing and marketing tools used by farms. We cannot tell from our data if and how farmers with futures brokerage accounts use futures.
It is important to recognize that farmers may use a wide array of price risk management tools beyond futures and options, including forward sales and crop insurance. Additionally, government payments at the times of low prices or heightened downside risks may reduce the need for farmers to rely on any specific risk management tool. These alternative means of price risk mitigation make futures less attractive for their direct use by farmers. However, futures markets also play a vital role in commodity price discovery from which farmers derive significant benefits, even if they do not trade futures and options themselves.
FBFM Data Acknowledgement
The authors acknowledge that data used in this analysis comes from the Illinois Farm Business Farm Management (FBFM) association. Without FBFM, information as comprehensive and accurate as this would not be available for educational purposes. FBFM, which consists of 5,000+ farmers and 70 professional field staff, is a not-for-profit organization available to all farm operators in Illinois. FBFM field staff provide on-farm counsel along with recordkeeping, farm financial management, business entity planning and income tax management. For more information, please contact the FBFM office located on the campus of the University of Illinois in the Department of Agricultural and Consumer Economics at 217-333-8346 or visit the FBFM website at www.fbfm.org.
References
Prager, D., Burns, C., Tulman, S., & MacDonald, J. “Farm Use of Futures, Options, and Marketing Contracts.” Economic Information Bulletin Number 219, USDA Economic Research Service, https://www.ers.usda.gov/webdocs/publications/99518/eib-219.pdf.
Disclaimer: We request all readers, electronic media and others follow our citation guidelines when re-posting articles from farmdoc daily. Guidelines are available here. The farmdoc daily website falls under University of Illinois copyright and intellectual property rights. For a detailed statement, please see the University of Illinois Copyright Information and Policies here.


