


Impact of Drought in the States in the Colorado River Basin on US Planted Acres
The February 6, 2025 farmdoc daily examined post 2014 Farm Bill acres of crops for which USDA, ERS (US Department of Agriculture, Economic Research Service) computes a cost of production. Private market return explained 44% of the changes in these acres. In this article, we examine if the on-going drought in the states that are in the Colorado River Basin (CRB) can help explain the changes in US crop acres. Taking the drought into account by removing acres in the states in the CRB from US acres improves explanatory power of private market return, but only to 50%. The implication is that factors other than private market return and drought in the states in the CRB are needed to explain changes in US acres over a period associated with the current US crop commodity programs.
Crop Acres, States in Colorado River Basin
States in the Colorado River Basin (CRB) are Arizona, California, Colorado, Nevada, New Mexico, Utah, and Wyoming. Average annual planted plus prevent plant acres in these seven states were lower in 2023-24 than 2012-13 for six of the seven cost of production crops in Figure 1. The exception was sorghum. Sorghum is a feed grain crop planted in drier areas, so an increase in its acres is consistent with on-going drought. Two cost of production crops, peanuts and soybeans; are not in Figure 1. Planted acres are not reported by USDA, NASS (National Agricultural Statistics Service) for these crops for all four years (2012, 2013, 2023, 2024) for any state in the CRB. Prevent plant acres are from USDA, FSA (Farm Service Agency). A recent set of articles in Choices has an extended, in-depth discussion of water issues in the CRB.

Percent Change in US Acres with and without States in the CRB
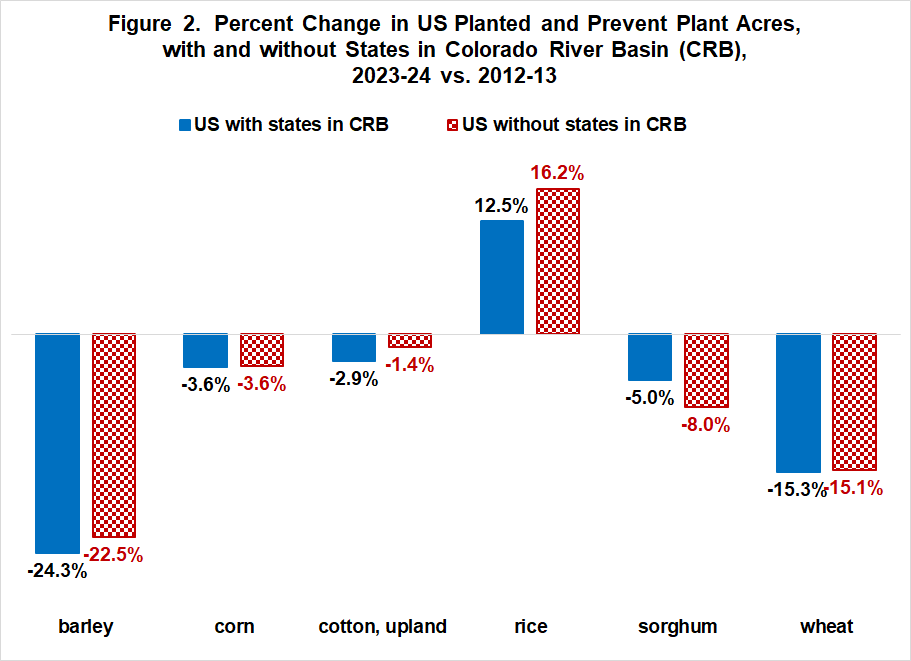
Excluding acres in the states in the CRB from US acres impacts rice and sorghum the most (see Figure 2). Acres of rice in the US excluding the states in the CRB have increased 3.7 percentage points more than have US acres with the states in the CRB (16.2% vs. 12.5%). Acres of sorghum in the US excluding the states in the CRB have declined 3.0 percentage points more than have US acres with the states in the CRB (-8.0% vs. -5.0%). Other notable impacts are a lower decline in barley and upland cotton acres once the states in the CRB are removed. As a group, states in the CRB have accounted for 21% of the decline in acres of US cost of production crops from 2012-13 to 2023-24 even though they accounted for only 3.3% of acres in these crops in 2012-13.
Return Adjustment for Rice
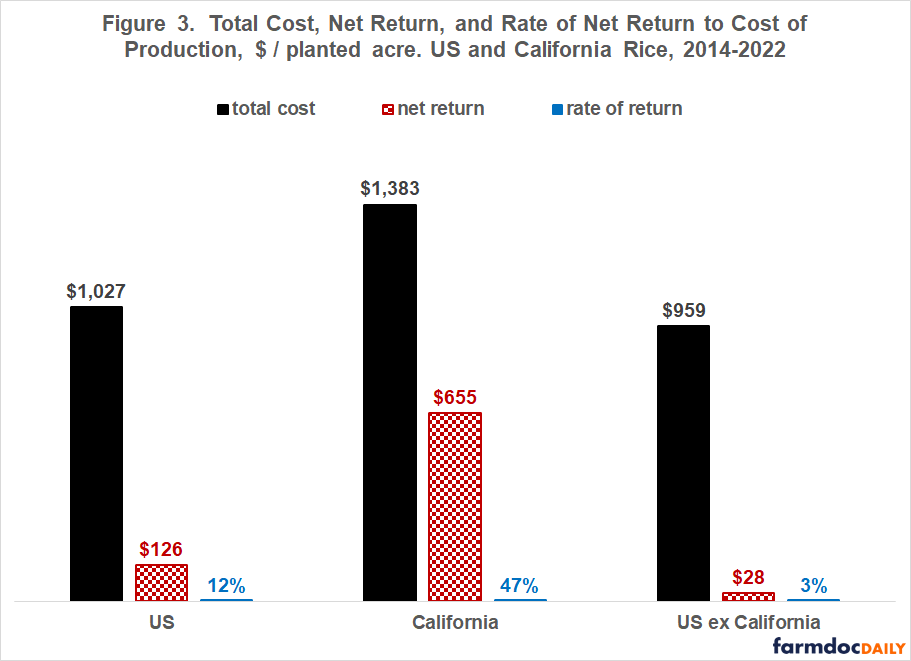
It is desirable to also adjust US cost of production and net return when excluding the states in the CRB. However, publically available data only permits such an adjustment for rice. Either the states in the CRB are not in a production region for which USDA, ERS reports costs or the production region covers more than the states in the CRB. Rice can be adjusted because a cost of production is reported for California and because California is the only state in the CRB for which USDA, NASS reports acres of rice. Over crop years 2014-22, California rice was much more profitable than US rice (see Figure 3). Rate of return was 12% for US rice including California rice but only 3% for US rice excluding California rice. The specific procedure used to adjust California rice is discussed in Data Note 1.
Relationship between Private Market Return and US Acres Excluding States in the CRB
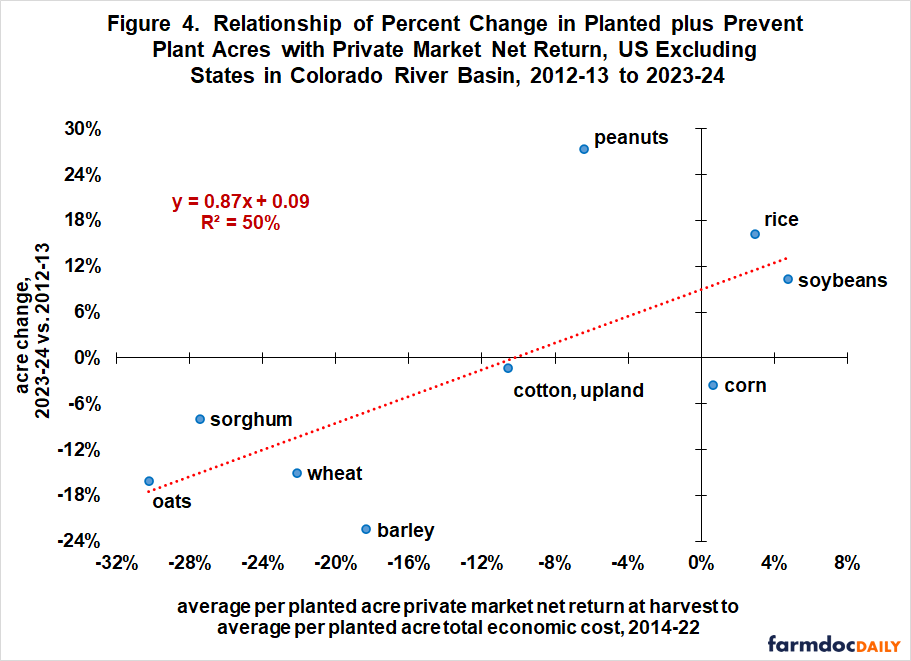
A regression relationship is estimated between percent change in US acres excluding the states in the CRB from 2012-13 to 2023-24 and average private market rate of return at harvest over the intervening period of 2014-22. Private market return explains half of the variation in percent change of acres across the nine crops (see Figure 4). Its positive coefficient is significant with 98% statistical confidence. The relationship estimated in the February 6, 2025 article for all US acres had explanatory power of 44% and was significant with 97% statistical confidence. Removing acres in the states in the CRB to account for the impact of on-going drought in these states improved explanatory power of private market rate of return but only to 50%.
Discussion
Drought has been on-going during the 21st Century for the states in the Colorado River Basin (CRB).
Drought is a variable other than private market return that can impact acres.
Consistent with the preceding point, states in the CRB have accounted for 21% of the decline in acres of US cost of production crops from 2012-13 to 2023-24 even though they accounted for only 3.3% of acres in these crops in 2012-13.
Removing acres in the states in the CRB from US acres improves the power of private market return to explain percent change in acres from 44% (February 6, 2025 farmdoc daily analysis), but only to 50%.
The implication is that factors other than private market return and drought in the states in the CRB account for half of the change in US acres over a period associated with current crop commodity programs.
In the next article, we examine if current commodity programs help explain the changes in acres.
Data Note 1: Procedures to Adjust Rice Costs and Returns
The following formula was used to adjust the cost per acre to produce US rice when the cost to produce rice in California is removed. A similar formula was used to adjust net return per planted acre.
- (1) cost per planted acre of rice in the US excluding California (CA) = [(US cost / acre times US planted acres) minus (CA cost / acre times CA planted acres)] / (US minus CA planted acres)
US rate of return excluding CA = (US ex CA net return / acre) divided by (US ex CA cost / acre).
References and Data Sources
Nemati, M. and Dinar A. 2024. Navigating through Whitewater: Understanding the Challenges and Opportunities in the Colorado River Basin. Choices. https://www.choicesmagazine.org/choices-magazine/theme-articles/colorado-river-basin/navigating-through-whitewater-understanding-the-challenges-and-opportunities-in-the-colorado-river-basin
US Department of Agriculture, Economic Research Service. February 2025. Cost of Production. https://www.ers.usda.gov/data-products/commodity-costs-and-returns/
US Department of Agriculture, Farm Service Agency. February 2025. Crop Acreage Data. https://www.fsa.usda.gov/tools/informational/freedom-information-act-foia/electronic-reading-room/frequently-requested/crop-acreage-data
US Department of Agriculture, National Agricultural Statistics Service. February 2025. QuickStats. http://quickstats.nass.U.S.da.gov/
U.S. Geological Survey. “Colorado River Basin Map.” November 3, 2016. Accessed February 14, 2025. https://www.usgs.gov/media/images/colorado-river-basin-map
Zulauf, C., J. Coppess, N. Paulson and G. Schnitkey. “Planted Acres and Private Market Profitability over the Current Crop Safety Net Period.” farmdoc daily (15):23, Department of Agricultural and Consumer Economics, University of Illinois at Urbana-Champaign, February 6, 2025.
Disclaimer: We request all readers, electronic media and others follow our citation guidelines when re-posting articles from farmdoc daily. Guidelines are available here. The farmdoc daily website falls under University of Illinois copyright and intellectual property rights. For a detailed statement, please see the University of Illinois Copyright Information and Policies here.