


Are US Crop Production Costs High?
A common headline is “High Crop Production Costs.” But, are costs high? To address a “high” question, a benchmark is needed. A common benchmark is history. We therefore examine cost in historical context. Once general US inflation and farmer adjustment strategies of yield growth and crop mix changes are taken into account, cost has changed little over the last 40 years. This finding underscores the importance of inflation and farmer adjustment strategies when considering crop costs. Not considering them increases the likelihood of inappropriate management and policy decisions.
Crop Production Cost Data
USDA, ERS (US Department of Agriculture, Economic Research Service) calculates an economic cost to produce barley, corn, cotton, oats, peanuts, rice, sorghum, soybeans, and wheat. Except for management, all inputs needed to plant, harvest, and put the crop in condition for storage are assigned a cost. Storage and crop insurance costs are not included. Inputs include unpaid labor and farmer-owned land, which are assigned an opportunity cost. Input quantity is based on periodic surveys of farms. Input price is updated annually using USDA, NASS (National Agricultural Statistics Service) data. Costs are available for 1975 – 2024 crops; 2024 costs are forecasts.
ERS estimate of per acre economic cost of production for a year and crop is multiplied by the acres USDA, NASS reported as planted to the crop in the year. Total cost to produce each cost of production crop in a year are summed, then divided by total acres planted to the nine crops in the year to generate a composite per acre economic cost to produce the nine crops as a group. Cost to produce a single crop is the usual focus, but composite cost is arguably more important. Farmers rarely plant a single crop, and thus can adjust their crop mix to reflect differential changes in cost by crop.
Current Dollar (i.e. Nominal) Cost per Acre
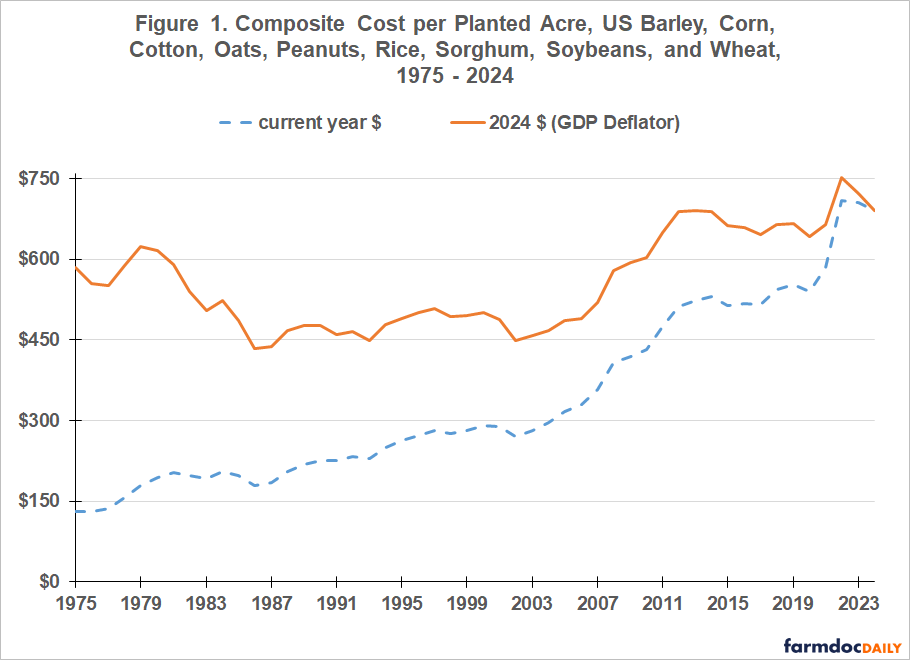
Since 1975, composite per planted acre cost to produce the nine cost of production crops as a group has consistently increased in terms of current dollars (blue line, Figure 1). The increase was fastest from 2003 to 2012, which overlaps the 2007-2013 period of crop prosperity. Composite cost then stabilized around $500 before again increasing after 2021. Current dollar crop cost is historically high.
Real (i.e. Deflated) Dollar Cost per Acre
Most crop inputs originate off farm and thus are impacted by general US inflation. Economists consider the GDP deflator to be the most complete measure of inflation. Deflating composite per acre cost to 2024 dollars using the GDP deflator reveals that real composite cost per planted acre declined from roughly $600 to $500 after the 1973-1980 period of crop prosperity (red line, Figure 1). Real cost fluctuated around $500/acre until the 2007-2013 period of crop prosperity, when it increased $200/acre ($491 in 2006 to $691 in 2013). As with current dollar cost, real cost per acre stabilized then increased after 2021. Peak composite cost was $752/acre in 2022. However, by 2024 it was back to $690/acre, almost identical with 2013. Real composite cost per planted acre has thus not increased since 2013. In other words, increases in current dollar composite cost of production for the nine crops as a group have tracked general US inflation since 2013.
Real (i.e. Deflated) Dollar Cost per Output Unit
The US crop sector can do little about general inflation except adjust to it. Adjustment strategies include changing the mix of crops and increasing yield. Real composite cost per output unit is therefore calculated. This metric includes both adjustment strategies and puts cost on the same basis as price, i.e. per output unit. Production is from PS&D, the Production, Supply, and Demand database that USDA, Foreign Agricultural Service maintains. Production is in the same unit for all crops, metric tons. Production of all crops for a year are summed to generate composite output. Composite output is divided by composite acres planted to the nine crops from USDA, NASS for the year, generating a composite yield for the year. Note, cotton production is only cottonseed production (see Data Note 1).
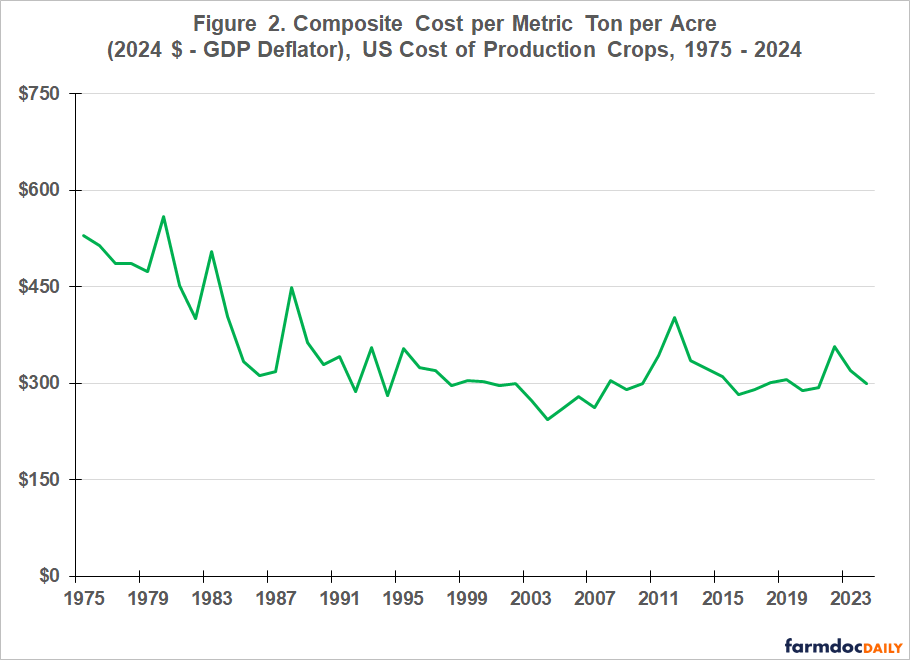
Since 2000, real composite cost per metric ton for the nine cost of production crops has fluctuated around $300 per metric ton, after declining from $500 per metric ton in the late 1970s / early 1980s (see Figure 2). Real composite cost for 2024 is estimated at $300 per metric ton, $3 below the post-1999 average of $303. Current real composite cost per output unit is not historically high.
Importance of Adjustment Strategies
Among the nine cost of production crops, soybeans and corn have the two highest cumulative sum of current dollar net return to the economic cost of production since 1975 (USDA, ERS). Consistent with being the two most profitable crops, soybean plus corn share of acres planted to the nine crops has increased from roughly 50% to 70% since the mid-1970s (USDA, NASS). Not considering this change in crop mix will lead to misinformed decisions regarding changes in cost of production and its relationship to crop profitability.
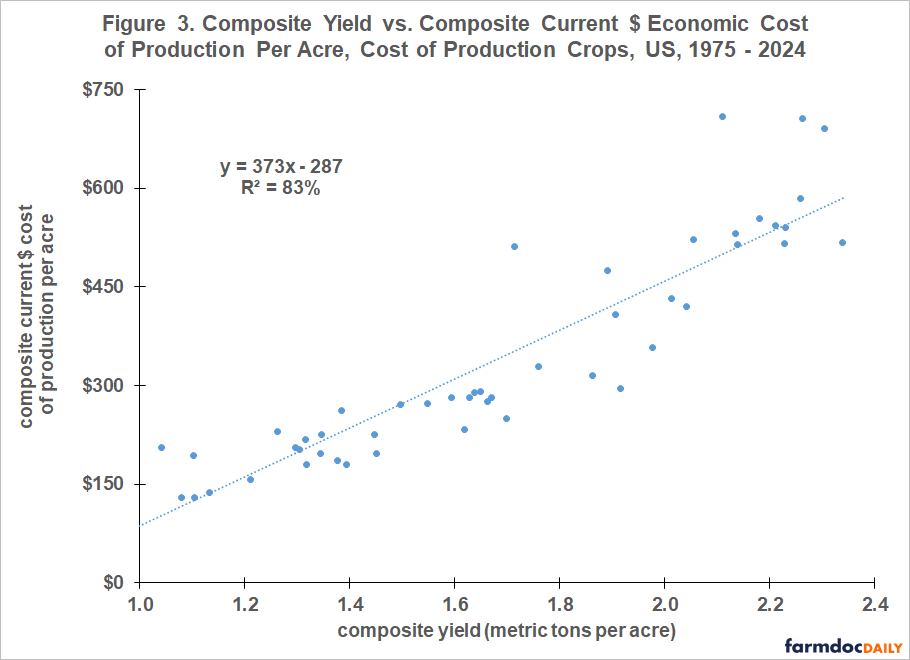
Composite yield for the nine cost of production crops tracks closely composite current dollar economic cost per acre to produce them (see Figure 3). Explanatory power is 82%; statistical significance is 99%. Not considering yield trend will lead to misinformed decisions regarding changes in cost of production and its relationship to crop profitability.
Discussion
This study underscores the important roles that general US inflation and farmer adjustment strategies to manage it play in the cost to produce US crops. Key strategies are yield growth and crop mix.
Not taking inflation and adjustment strategies into account results in misinformed perspectives.
After adjusting for inflation and changes in crop mix, real cost per acre to produce the nine US cost of production crops as a group has not increased since 2013.
After adjusting composite real cost per acre for yield growth, real cost per output unit to produce the nine US cost of production crops as a group has not increased in the 21st Century.
These findings do not support using recent increases in current dollar (i.e. nominal) cost to raise revenue-per-acre support in ARC (Agricultural Risk Coverage) and price support, such as loan rates and PLC (Price Loss Coverage) reference prices. Raising these supports (thus, program payment rates) is especially problematic since each support has a floor that prevents declines in support if cost, real or nominal, declines. Moreover, program design allows ARC benchmark revenue to increase via moving averages if price or yield increase and PLC reference prices to increase via the 2018 Farm Bill escalator clause.
Trying to protect farmers from general inflation by raising support is likely to imbed general inflation in the cost of production, undermining the cost competitiveness of US crops in the private market, an outcome illustrated by the 1981 Farm Bill (see farmdoc daily July 6, 2022). The result was a large increase in government spending in the 1985 Farm Bill to correct this policy misstep.
Data Note 1
Using PS&D data, from 1975-1979 to 2020-2024, US cotton lint yield per acre increased 81% while US cottonseed yield per acre increased 42%. Using cottonseed yield understates the increase in cotton yield in total and thus results in a conservative measure of cotton yield’s impact on cost.
References and Data Sources
Federal Reserve Bank of St. Louis. March 2025. Federal Reserve Economic Data (FRED) – GDP deflator. https://fred.stlouisfed.org
US Department of Agriculture, Economic Research Service. January 2025. Cost of Production. https://www.ers.usda.gov/data-products/commodity-costs-and-returns/
US Department of Agriculture, Foreign Agriculture Service. March 2025. PS&D: Production, Supply, and Demand. https://apps.fas.usda.gov/psdonline/app/index.html#/app/home
US Department of Agriculture, National Agricultural Statistics Service. March 2025. QuickStats. http://quickstats.nass.U.S.da.gov/
Zulauf, C., G. Schnitkey, K. Swanson, J. Coppess and N. Paulson. “2024 Farm Bill Dilemma, 1981 Farm Bill, and 2018 Farm Bill Price Support Adjustments.” farmdoc daily (12):101, Department of Agricultural and Consumer Economics, University of Illinois at Urbana-Champaign, July 6, 2022.
Disclaimer: We request all readers, electronic media and others follow our citation guidelines when re-posting articles from farmdoc daily. Guidelines are available here. The farmdoc daily website falls under University of Illinois copyright and intellectual property rights. For a detailed statement, please see the University of Illinois Copyright Information and Policies here.