


Decomposition of Changes in Net Worth
There are three major changes that contribute to an increase or decrease in net worth: change in retained earnings, change in contributed capital, and change in market valuation. Change in retained earnings measures the amount of net income in a particular year that is retained in the business. In addition to being retained in the business, net income can be used for owner withdrawals and to pay income taxes. Net income includes both net farm income and personal income. The change in capital contributions accounts for gifts, debts forgiven, and capital contributions and distributions. The change in market valuation subtracts the change in deferred liabilities from the change in the market value of capital assets. Deferred liabilities represent an amount that is owed if an asset is sold. Tracking changes in net worth over time is one of the most important tasks of those in charge of analyzing a farm’s financial position and performance. This article examines changes in net worth from 2007 to 2024 using sample of farms and decomposes this change into its three components: retained earnings, contributed capital, and market valuation.
FINBIN data from 2007 to 2024 for all crop farms were utilized in this study. Specifically, annual data from the statement of owner’s equity for all crop farms were summarized. Table 1 contains the average, standard, deviation, and coefficient of variation (standard deviation divided by average) for the change in net worth and its component over the time period. The retained earnings computation included both net income and personal income. Approximately 62% of the change in net worth can be attributed to retained earnings. Another 34% can be attributed to the change in market valuation. The change in contributed capital contributed the remaining 4%. The average annual increase in net worth was 9.5 percent.
In addition to changes in net worth, Table 1 contains summary statistics for net farm income, personal income, and owner withdrawals. Personal income and owner withdrawals were substantially less variable than net farm income or retained earnings. The ratio of retained earnings to net farm income was approximately 0.75, indicating that, on average, approximately 25% of net income was not retained in the business. On average, net farm income represented approximately 19 percent of gross farm income. These percentages would vary considerably among individual farms.
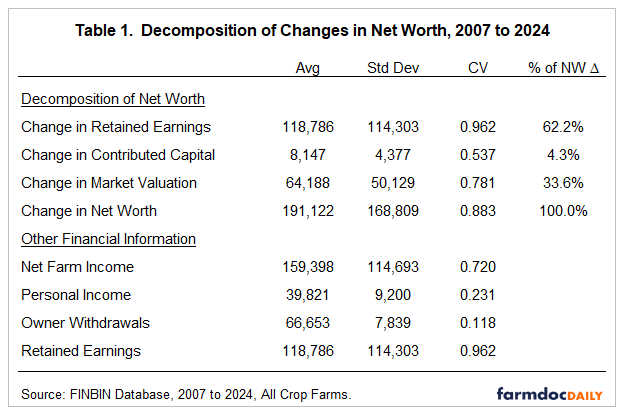
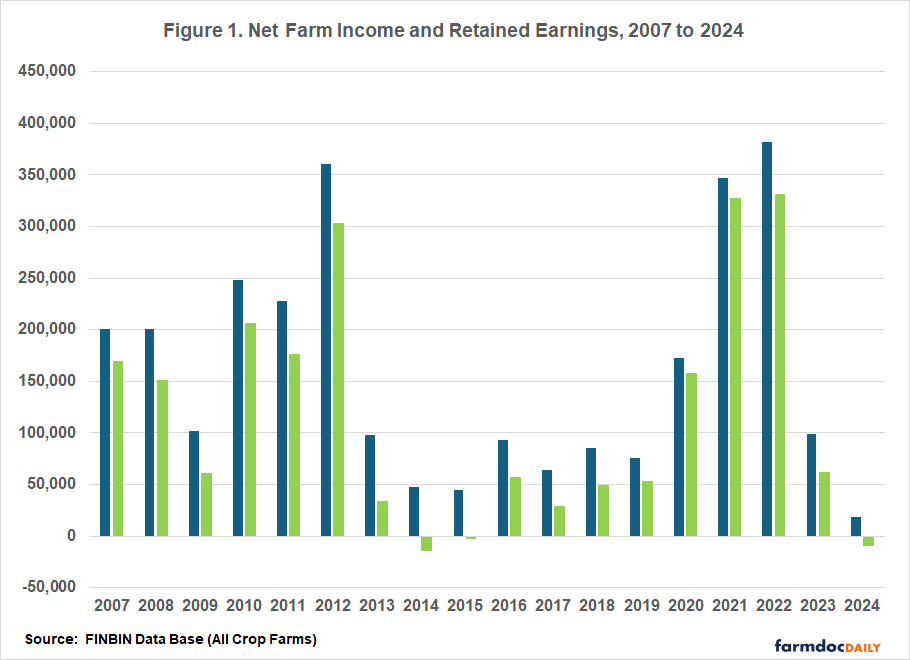
Figure 1 illustrates the annual average net farm income and retained earnings for each year analyzed in this study. Obviously, there is a lot of variability in each measure. Net farm income was positive in every year. However, retained earnings were negative in 2014, 2015, and 2024. Retained earnings is used to make term debt payments and to provide down payments on capital assets. In years when retained earnings are low, current assets, particularly cash, are used to make these payments.
Though not illustrated in a table or figure, data for crop farms with less than 1000 acres and greater than 1000 acres were also analyzed. Average net farm income and retained earnings for the farms with less than 1000 acres (greater than 1000 acres) were $76,533 and $62,926 ($263,237 and $188,045), respectively. The gap between net farm income and retained earnings was narrower for the farms with less than 1000 acres due to their increased reliance on personal (i.e., non-farm) income. The higher retained earnings for the farms with more than 1000 acres indicates that these farms have more funds to repay debt and to make down payments on capital assets. Interestingly, annual retained earnings were positive for every year for the smaller farms. In contrast, retained earnings were negative for the larger farms in 2014, 2015, and 2024.
In summary, during the 2007 to 2024 period, a majority of the change in net worth for a sample of farms contributing information to the FINBIN database was attributed to retained earnings. Given the relatively large change in land values that occurred during this period, this points to the strong financial performance that production agriculture has experienced since 2007. Future articles will examine the percentage growth in net worth for farms with low and high debt to asset ratios, and examine trends in sources and uses of funds since 2007.
References
Center for Farm Financial Management, University of Minnesota, FINBIN database, accessed April 23, 2025. https://finbin.umn.edu/
Disclaimer: We request all readers, electronic media and others follow our citation guidelines when re-posting articles from farmdoc daily. Guidelines are available here. The farmdoc daily website falls under University of Illinois copyright and intellectual property rights. For a detailed statement, please see the University of Illinois Copyright Information and Policies here.