


Agri-Food Transportation by Highway, Railway, and Waterway in the United States
In recent research we used real-world data to map the distribution of agri-food commodities onto the highway, railway, and waterway networks across the continental United States. We additionally evaluated transportation for domestic, export, and import purposes. Figure 1a shows that highways handle the largest total mass of food transportation, followed by railways and then waterways.
Figure 1 presents a breakdown of agri-food flows across transportation modes by commodity group and flow type. Notably, cereal grains (SCTG 02) dominate flows on railways and waterways—accounting for 58% and 52% of mass moved on those modes, respectively—while they constitute a smaller fraction on highways (35%). Agricultural products (SCTG 03), including fruits, vegetables, and soy, make up nearly 38% of all waterway traffic, largely due to soybean exports via the Mississippi River. Meanwhile, commodities requiring ventilation or refrigeration, such as live animals (SCTG 01) or meats (SCTG 05), are predominantly moved by highways, as railways and waterways are less suitable for temperature-sensitive goods. The majority of transportation is for domestic purposes across modes, with a higher proportion of railways and waterways serving export markets. This figure underscores how the physical properties of goods influence their transit mode and the specialization of each transportation network.
Figure 1. Breakdown of Empirical Agri-Food Flows Data
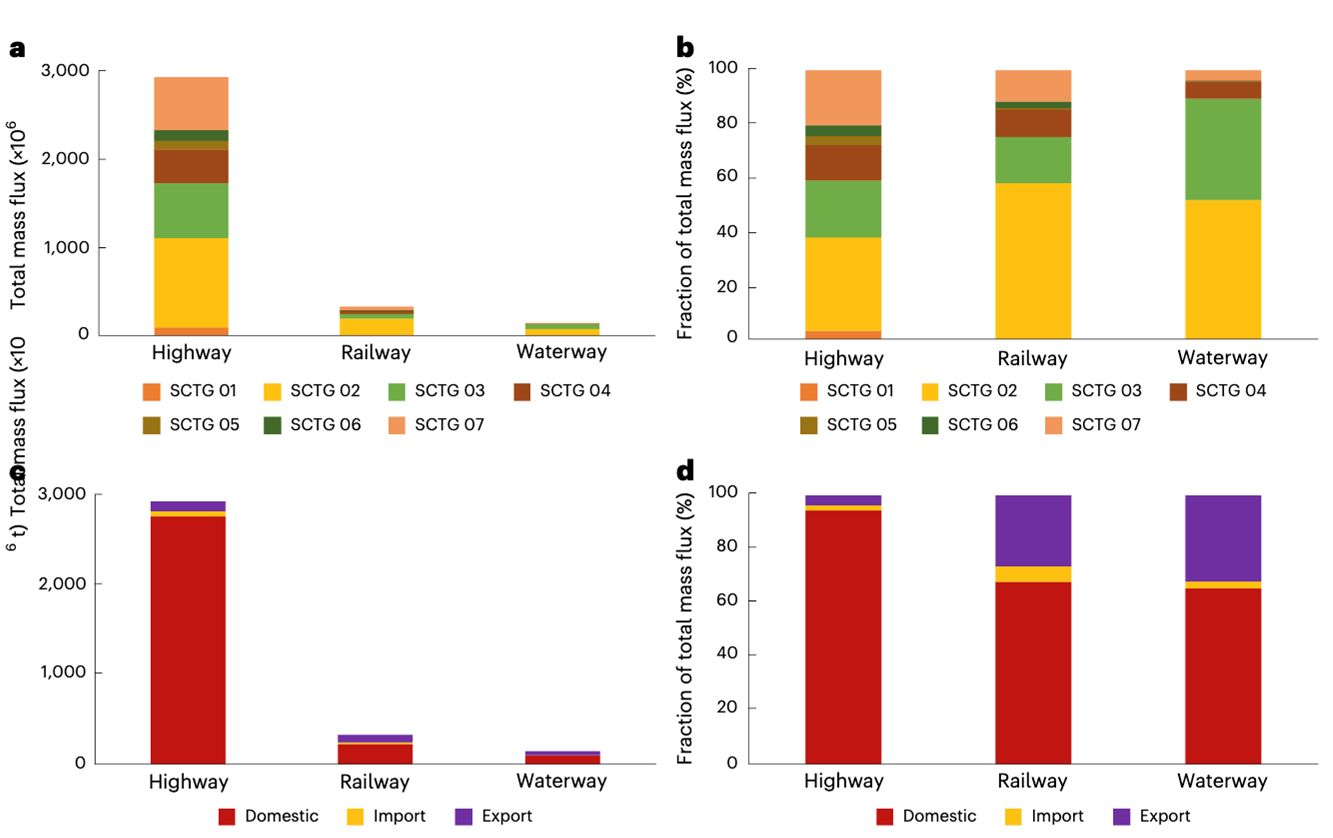
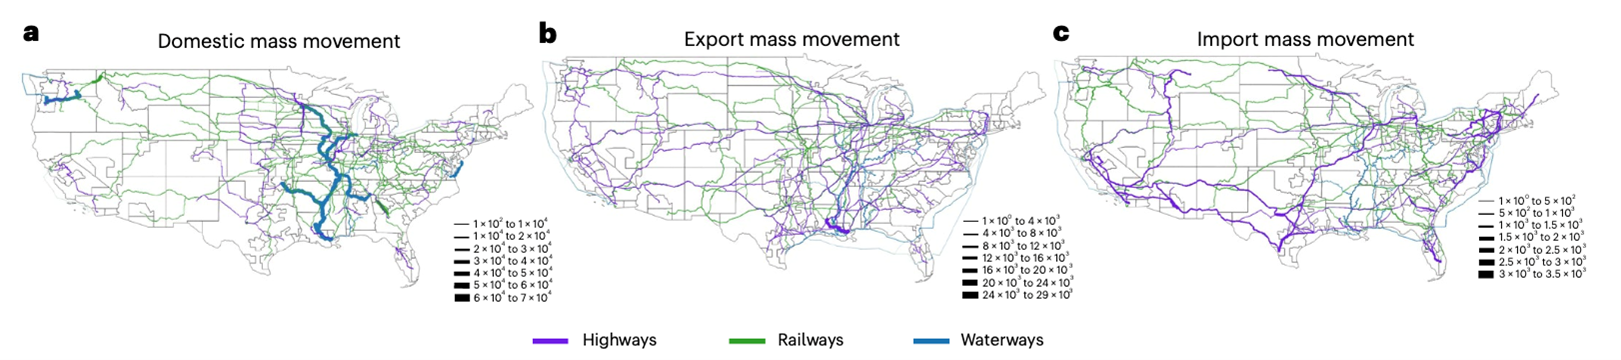
Figure 2 visualizes the top 100 mass agri-food movements between FAF (Freight Analysis Framework) regions by mode and flow type. The map illustrates that domestic flows via inland waterways are heavily concentrated along the Mississippi River, reinforcing its role as a major corridor. Railways link the East and West coasts with high-volume routes, while highways serve regional movement—especially in the Midwest and California. For exports, highways to the Port of New Orleans are prominent, and railways funnel commodities from the Midwest to the West Coast. Import flows are primarily handled by highways near major border regions, such as California and Texas, with railways and waterways playing smaller roles. This visualization highlights how logistical strategies differ by mode and purpose, shaped by both geographic and infrastructural constraints.
Figure 2. Agri-Food Flows by Mode and Flow Type
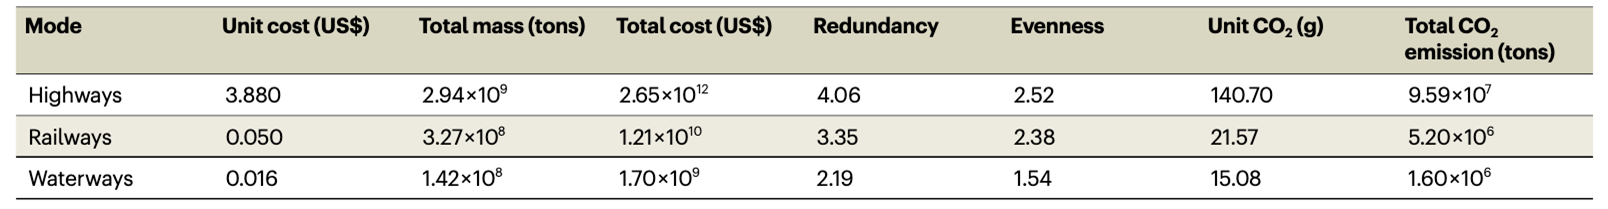
We additionally quantified the performance of each transportation mode in terms of cost carbon emissions, and path redundancy (see Table 1). Highways are the most expensive and have the highest carbon emissions, but offer the highest resilience due to their extensive path redundancy and evenly distributed flows. Waterways are the most efficient and have the lowest carbon emissions, but suffer from limited path redundancy due to their geographic reach, making them more vulnerable to disruptions. Railways lie in between, with moderate scores across all metrics.
Table 1. Total Cost of Agri-Food Transport, Path Redundancy of the Transportation Network, Evenness of the Agri-Food Flow and Total Carbon Emission of the Agri-Food Transit Within the Transportation Network, per mode, m.
Thus, our study represents a comprehensive mapping of how agri-food commodities are transported within the United States. The majority of the mass is allocated to highways, irrespective of the commodity group and whether the transport is for domestic, import, or export purposes. Inland waterways shift a large load for domestic purposes, with the Mississippi river-bend as the backbone of transit. For export, highways connecting the U.S. to the Port of New Orleans are key; however, for imports, highways in California and along the U.S.-Mexico border shift the most bulk. Waterways shift agri-food at the lowest cost but with the lowest flexibility to re-route if there is a disruption, such as low- or high-water levels. Highways are the most flexible in case of disruption, but the most expensive. Decision-makers can consider these transportation features in their efforts to improve the affordability, resilience, and sustainability of agri-food supply chains.
Note
This article is based on Karakoc, D.B., and M. Konar (2025) Trade-offs between resilience, sustainability and cost in the US agri-food transportation infrastructure Nature Food, doi: 10.1038/s43016-025-01128-9.
Disclaimer: We request all readers, electronic media and others follow our citation guidelines when re-posting articles from farmdoc daily. Guidelines are available here. The farmdoc daily website falls under University of Illinois copyright and intellectual property rights. For a detailed statement, please see the University of Illinois Copyright Information and Policies here.