


2025 Q1: Capital Adequacy of U.S. Commercial Banks Participating in Agricultural Lending
In today’s article, we build on our previous findings on bank performance (see farmdoc daily, June 11, 2025) and examine the differences in capital adequacy between agricultural and non-agricultural banks during the first quarter of 2025, using data from the Federal Deposit Insurance Corporation (FDIC). A bank’s capital serves as an important buffer against unforeseen losses and asset devaluations that could potentially lead to bank failure. Given that banks typically maintain relatively low levels of capital compared to the size of their balance sheets, regulatory oversight and financial monitoring of their condition are essential in maintaining the stability of the banking system. Bank capital is categorized into Tier 1 capital and Tier 2 capital. Tier 1 capital is the core capital of a bank, while Tier 2 capital is supplementary capital and is less secure than Tier 1 capital.[1]
We limit our analysis to commercial banks that are supervised by the FDIC, Office of the Comptroller of the Currency (OCC), or the Federal Reserve (FR) that report outstanding farm real estate or operating loans on their balance sheets. We define two lending specializations among these banks. Commercial banks whose combined farm real estate and operating loans account for at least 25% of their gross loans and leases are categorized as agricultural banks, while those below this threshold are categorized as non-agricultural banks.
The majority of commercial banks, including those specializing in agricultural lending, are classified as community banks. These institutions play an important role in supporting local economies and serving the financial needs of communities across the country. According to the Federal Reserve, a community bank is defined as a banking organization with less than $10 billion in assets (see Community & Regional Financial Institutions). In the first quarter of 2025, 941 of the 949 commercial banks identified as agricultural banks for our analysis met the criteria of being classified as community banks. Similarly, 2,233 of the 2,510 non-agricultural banks were also classified as community banks.
To lessen the regulatory burden on these entities, the Economic Growth, Regulatory Relief, and Consumer Protection Act (S.2155) resulted in the introduction of the Community Bank Leverage Ratio (CBLR) framework as an optional but simpler alternative to existing risk-based capital requirements (see S.2155, 25 May, 2018). Community banks that elect to be evaluated under the CBLR framework are required to maintain a Tier 1 leverage ratio above 9 percent, where the ratio is defined as Tier 1 capital divided by average total consolidated assets (see Community Bank Leverage Ratio Framework, October 2019). Since this is the only leverage ratio required to be reported under the framework, we will use it to assess capital adequacy, ensuring a consistent comparison with non-community banks that also report this measure (see Risk Management Manual of Examination Policies, Capital, Section 2.1). A higher Tier 1 leverage ratio signals a stronger capital position, indicating that a bank is better positioned to absorb losses and is less likely to experience insolvency.
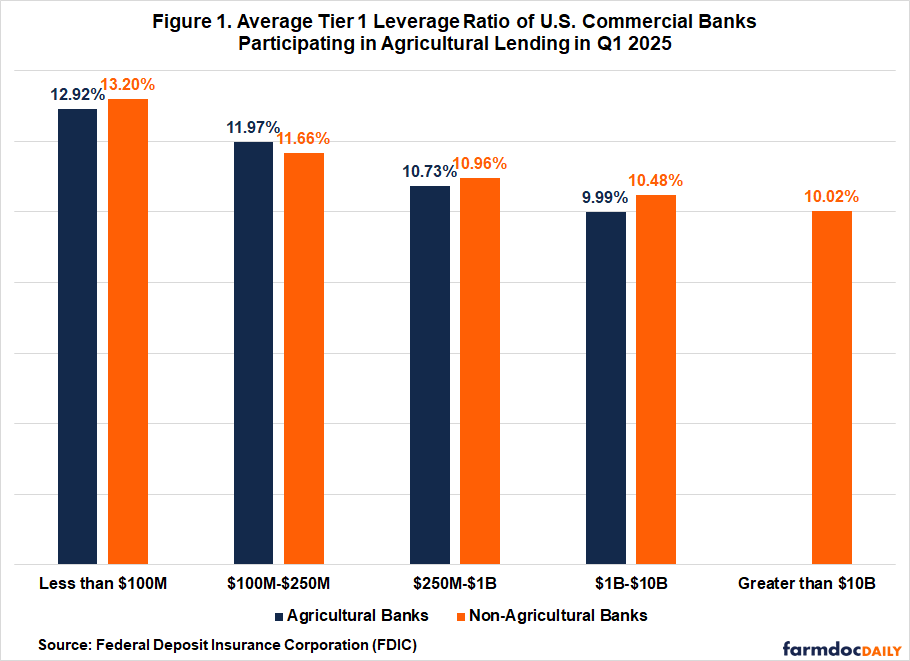
Figure 1 shows that, on average, under the CBLR framework, both agricultural and non-agricultural banks maintained Tier 1 leverage ratios above 9% across all asset size categories in the first quarter. Overall, the average ratio for agricultural banks in our sample was 11.73%, compared to a lower ratio of 11.16% for non-agricultural banks. These ratios are higher than a year ago, when the ratio for agricultural banks was 11.62% and 10.93% for non-agricultural banks. While no agricultural bank in the sample had total assets exceeding $10 billion, they reported lower leverage ratios on average than non-agricultural banks, except for those with $100 million to $250 million in assets. Among agricultural banks, the average leverage ratio declined as the bank asset size increased, where the largest of these banks with assets of $1 billion to $10 billion, had the lowest average ratio of 9.99%. Conversely, non-agricultural banks did not exhibit the same consistent trend in the first quarter. However, those with assets greater than $10 billion had the lowest average leverage ratio among their group, at 10.02%.
The smallest agricultural and non-agricultural banks, those with less than $100 million in assets, had the highest average leverage ratios. Agricultural banks in this size category had an average ratio of 12.92%, while their non-agricultural counterparts were higher at 13.20%. Compared to large commercial banks—such as JPMorgan Chase, Bank of America, and Citibank—the balance sheets of small banks typically report higher levels of capital relative to their assets. Not only is this evident in Figure 1 in Q1, but Figure 2 shows how over two decades this has generally been the case. In Figure 2, we can see that since the first quarter of 2002, across both specializations, smaller banks on average often had stronger tier 1 leverage ratios compared to larger ones. This is because larger banks tend to operate more diversified portfolios—both geographically and across economic sectors—which reduces their overall risk exposure and allows them to operate with less capital on hand (see Federal Reserve Bank of Philadelphia Economic Insights, First Quarter 2021).
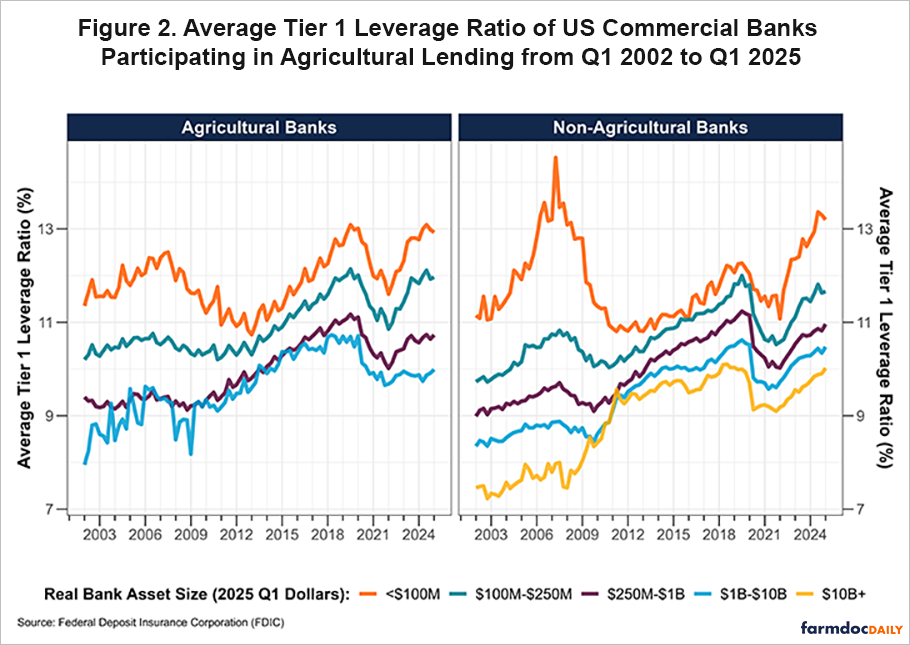
Note. 1. Rabobank and Great Western Bank are excluded from the Agricultural Banks (left) panel.
Conclusion
In conclusion, our analysis of Tier 1 leverage ratios for the first quarter of 2025 provides important insights into the capital adequacy of both agricultural and non-agricultural commercial banks. Given that most commercial banks in the U.S. are classified as community banks, we follow the Community Bank Leverage Ratio (CBLR) guidelines to assess the condition of our sample of banks making agricultural loans. On average, agricultural banks reported a Tier 1 leverage ratio of 11.73% in the first quarter of 2025, an increase from 11.62% in the same quarter of the previous year. Non-agricultural banks had a lower average ratio of 11.16%, up from 10.93% a year earlier. While on average both types of banks met the CBLR requirement of having a ratio above 9%, agricultural banks had lower leverage ratios across all comparable asset size categories, except for those holding between $100 million and $250 million in assets. We also show that smaller banks, regardless of specialization, have generally maintained higher capital levels relative to their assets over the past two decades. This is due to the fact that larger banks typically maintain more diversified portfolios, spanning different geographic regions and economic sectors. This diversification lowers their overall risk exposure, enabling them to hold less capital.
Notes
[1] Tier 1 capital consists of common stock, retained earnings, and accumulated other comprehensive income. Tier 2 capital consists of loan-loss reserves, subordinated debt, revaluation reserves, hybrid instruments, and undisclosed reserves.
References
Elliott, P. J. (2021). Banking trends: How and why bank capital ratios change over the business cycle. Economic Insights, 6(1), 17-22. https://www.philadelphiafed.org/-/media/frbp/assets/economy/articles/economic-insights/2021/q1/bt-how-and-why-bank-ratios-change.pdf?la=en&hash=139C770A2699DD508FC9B01C4544318E
Mashange, G. "Q1 2025: The Profitability of U.S. Commercial Banks Participating in Agricultural Lending." farmdoc daily (15):107, Department of Agricultural and Consumer Economics, University of Illinois at Urbana-Champaign, June 11, 2025.
Disclaimer: We request all readers, electronic media and others follow our citation guidelines when re-posting articles from farmdoc daily. Guidelines are available here. The farmdoc daily website falls under University of Illinois copyright and intellectual property rights. For a detailed statement, please see the University of Illinois Copyright Information and Policies here.