


Q1 2025: The Profitability of U.S. Commercial Banks Participating in Agricultural Lending
In today’s article, we examine the performance of U.S. commercial banks participating in agricultural lending during the first quarter of 2025, using data from the Federal Deposit Insurance Corporation (FDIC). Our analysis focuses on commercial banks that are supervised by the FDIC, Office of the Comptroller of the Currency (OCC), or the Federal Reserve (FR) with outstanding farm real estate or operating loans on their balance sheets. We define two lending specializations among these banks. Commercial banks whose combined farm real estate and operating loans account for at least 25% of their gross loans and leases are categorized as agricultural banks, while those below this threshold are categorized as non-agricultural banks.
Among the 3,459 commercial banks reporting agricultural loans in the first quarter, 949 were categorized as agricultural banks and 2,510 as non-agricultural banks. At agricultural banks, production loan balances declined by $2.32 billion (6.28%) from the previous quarter to $34.65 billion, while farm real estate loans fell by $1.64 billion (3.44%) to $46.05 billion. Over the same period, production loan balances at non-agricultural banks declined to $45.31 billion (down $785.87 million or 1.70%), whereas farm real estate loans increased by $1.38 billion (2.00%) to $70.29 billion. On a year-over-year basis, production loans rose by $2.26 billion (6.97%) at agricultural banks and by $1.58 billion (3.61%) at non-agricultural banks. Farm real estate loans also increased compared to the same time last year, rising by $370.81 million (0.81%) at agricultural banks and $1.27 billion (1.84%) at non-agricultural banks.
Table 1 shows the distribution of our sample by bank asset size and lending specialization in the first quarter of 2025. For each lending specialization, the components of net interest margin are reported. Net interest Margin (NIM) is defined as the difference between the Yield on Earning Assets (YEA) i.e., interest income as a percentage of average earning assets, and the Cost of Funding Earning Assets (COF) i.e., interest expense as a percentage of average earning assets.[1] NIM measures a bank’s profitability and how well it manages the spread between what it earns on assets that generate income and what it pays to fund those assets. What drives the NIM are changes in the YEA and COF.
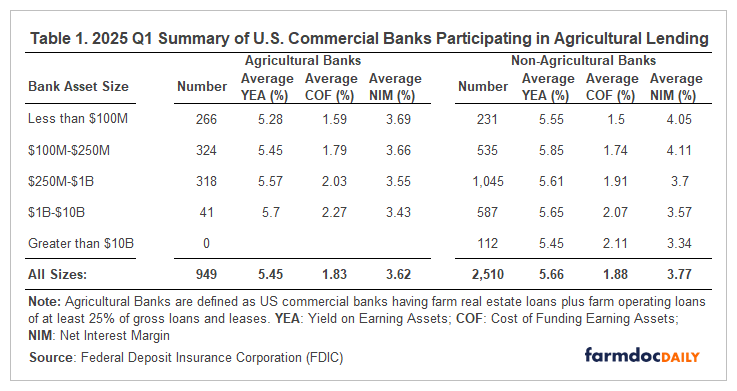
On average, agricultural banks reported a lower NIM of 3.62% in the first quarter of 2025 compared to 3.77% for non-agricultural banks, as shown in Table 1. While the average NIM for agricultural banks remained unchanged from the previous quarter, it declined by 3 basis points from 3.80% for non-agricultural banks. When broken down by bank size, agricultural banks, none of which exceeded $10 billion in total assets, consistently reported lower average NIMs across all other asset size categories. In the first quarter, non-agricultural banks reported an average yield on earning assets (YEA) of 5.66%, which was 21 basis points higher than the 5.45% average for agricultural banks. Additionally, agricultural banks with $1 billion to $10 billion in assets reported the highest average yield on earning assets (YEA) at 5.70%, while the highest average YEA was even higher at 5.85% for non-agricultural banks with $100 million to $250 million in assets. Compared to the previous quarter, the average YEA fell for both lending specializations, declining by 12 basis points from 5.57% to 5.45% for agricultural banks and by 15 basis points for non-agricultural banks from 5.81% to 5.66%. The average cost of funding earning assets (COF) was slightly lower for agricultural banks at 1.83 percent, compared to 1.88 percent for non-agricultural banks. When bank size is considered, the lowest average COF was reported by the smallest banks—those with less than $100 million in total assets—for both agricultural (1.59%) and non-agricultural (1.50%) banks. For all other size categories except those greater than $10 billion, agricultural banks, consistently reported higher average COFs.
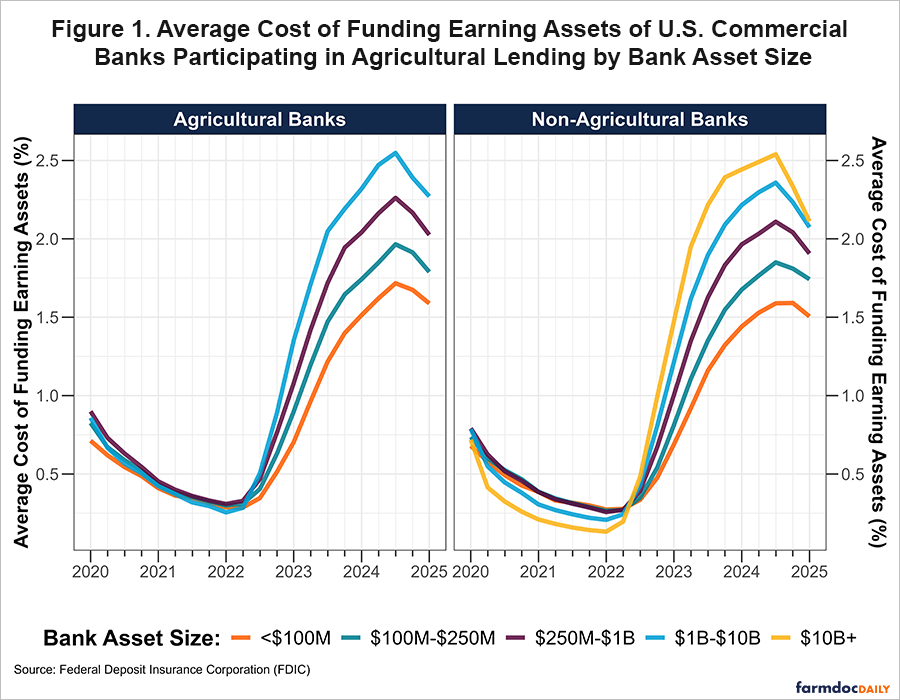
How Have Funding Costs Changed since 2020 Across Bank Asset Size Categories?
Average funding costs for commercial banks have eased since the Federal Reserve began cutting the federal funds rate (FFR) in September 2024, as shown in Figure 1. The policy shift followed an aggressive rate-tightening cycle, during which the Fed raised the FFR 11 times—from near zero in March 2022 to a target range of 5.25-5.50 percent in July 2023. As the FFR rose, differences in funding costs across bank asset sizes in both lending specializations began to widen with larger banks increasing costs at a faster rate. For example, in March 2022, the average COFs for agricultural banks ranged from 0.26 to 0.31 percent (5 basis points), and 0.13 to 0.27 percent (14 basis points) for non-agricultural banks. By September 2024, at the end of the rate-hiking cycle, the average COFs had risen and ranged from 1.72 to 2.55 percent (83 basis points) for agricultural banks, and 1.59 to 2.54 percent (95 basis points) for non-agricultural banks. Currently, the target range for the FFR is 4.25-4.50 percent, down from last September’s 4.75-5.00 percent range. However, there is a lot of uncertainty regarding what direction the Fed will take on interest rates this year. More time is needed to see how the Trump administration’s domestic and trade policies will impact U.S. economic data in the coming months.
Conclusion
Total production and farm real estate loan balances declined by 6.28% and 3.44%, respectively, at agricultural banks during the first quarter of 2025. In contrast, non-agricultural banks reported a smaller decline in production loan balances (down 1.70%) while farm real estate loan balances increased by 2.00% from the previous quarter. In terms of profitability, agricultural banks reported a lower average net interest margin (NIM) of 3.62 percent compared to 3.77 percent for non-agricultural banks. Similarly, the average cost of funding earning assets (COF) and yield on earning assets (YEA) for agricultural banks (1.83 and 5.45 percent, respectively) was lower than that of non-agricultural banks (1.88 percent and 5.66 percent, respectively).
Note
[1] Earning assets are all loans and other investments that earn interest or dividend income.
Disclaimer: We request all readers, electronic media and others follow our citation guidelines when re-posting articles from farmdoc daily. Guidelines are available here. The farmdoc daily website falls under University of Illinois copyright and intellectual property rights. For a detailed statement, please see the University of Illinois Copyright Information and Policies here.