


Crop Insurance, 2025 Farm Bill, and Mission Creep
The modern US crop insurance program has undergone progressive, substantial mission creep since its creation by the Federal Crop Insurance Act of 1980. Coverage levels, Federal premium subsidy rates, and types of risk covered have all increased. Of particular note, the offering of ECO (Enhanced Coverage Option) insurance starting with the 2021 crop year, the increase in ECO subsidy rate to 65% for 2025 crops, and the 2025 Farm Bill increase in SCO (Supplemental Coverage Option) coverage to 90% with an 80% subsidy rate (see farmdoc daily July 2, 2025) all point to crop insurance policy entering a new chapter: publicly subsidized management of price risk.
Mission Creep
In 1989, the highest coverage level was 75% (see Table 1). Highest current crop insurance coverage level is 95%, specifically for ECO and MCO (Margin Coverage Option) insurance.
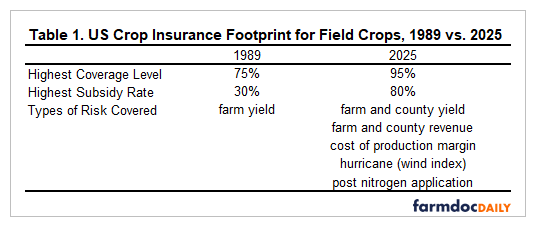
The Federal Crop Insurance Act of 1980 authorized premium subsidies of 30% for coverage levels of 65% or lower (Glauber, 2013). For higher coverage levels, dollar amount of the Federal premium subsidy was capped at the dollar amount of the subsidy for 65% coverage. Percent subsidy thus declined for coverage levels above 65%. Post the 2025 Farm Bill, highest subsidy rates are (a) 69% for basic and optional insurance units at 55% and 60% coverage and (b) 80% for enterprise insurance units at 50% to 70% coverage and for SCO and STAX (Stacked Income Protection Plan) area add-up insurance. Their top coverage is 90%. STAX only covers cotton.
Prior to 1997, the US crop insurance program covered only the risk of farm level yield decline. Revenue products were introduced in 1997 and now exceed 90% of insured acres for corn, grain sorghum, soybeans, and wheat while being slightly below 90% for cotton. Revenue products cover the risk of declines in both price and yield over the growing season. Net return, hurricane / wind, and post planting application of nitrogen products also exist now.
Growing Season Price Risk
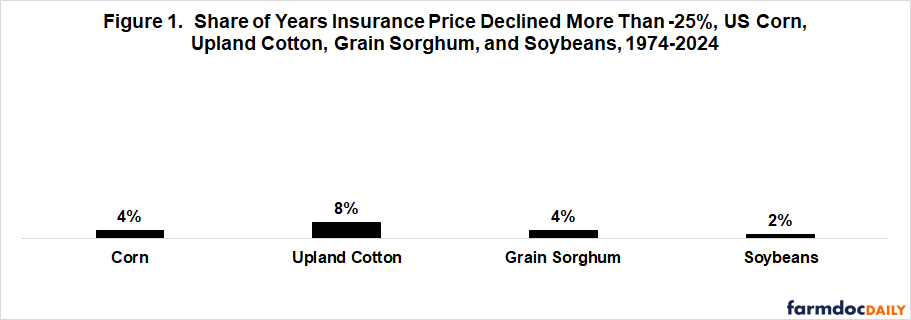
Coverage and subsidy creep are creating a major change in the program footprint of crop insurance. Specifically, price risk was minimally covered when 75% was the highest coverage level. Since 1973, the share of years in which crop insurance price declined more than -25% over the growing season ranged from 2% for soybeans (i.e. 1 year) to 8% for upland cotton (i.e. 4 years) (see Figure 1). The average for the four crops was 4% (i.e. 2 years). See the Data Note for a discussion of the data and procedures used in this article.
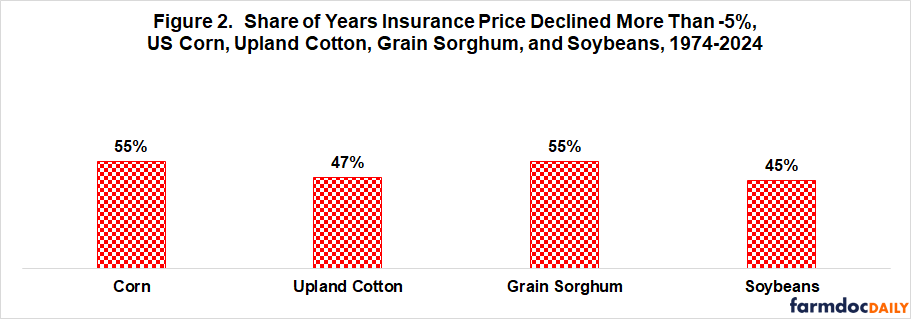
In contrast, share of years in which crop insurance price declined more than -5%, which is consistent with 95% coverage, ranged from 45% for soybeans (i.e. 23 years) to 55% (i.e. 28 years) for corn and grain sorghum. The average was 50%, or one-half of the 51 years.
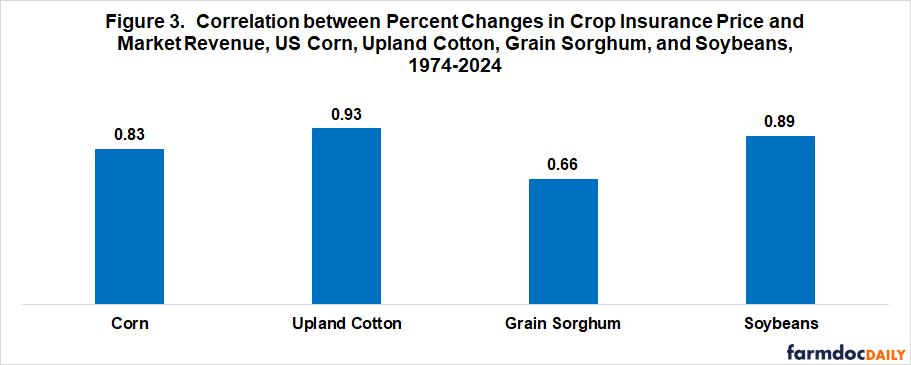
Crop insurance offers no price risk only products, but does offer revenue (price time yield) products. Percent changes in insurance price and US revenue per acre over the growing season are highly correlated (see Figure 3). All correlations are positive and significant with 99% statistical confidence. US market revenue per acre is the average US revenue per acre of a crop. Thus, in contrast to 75% insurance, 95% insurance covers a substantial share of price risk for the average acre of a US crop over its growing season.
Policy Discussion
The increase in crop insurance coverage level has resulted in much greater coverage of price risk.
The increase in coverage levels has been reinforced by recent increases in subsidy rates for ECO and SCO. These increases reduce the cost to farmers of buying 90% and 95% coverage, thus making price risk protection via crop insurance more affordable.
The reduction in price risk by crop insurance is moderated by (a) price basis risk between futures prices and the cash prices farmers receive and (b) by indirect protection via revenue products rather than direct protection via price products. Nevertheless, revenue insurance at high coverage levels provides nontrivial price risk protection. It is likely no coincidence that use of ECO has more than tripled across large acreage field crops in 2025 following the summer 2024 increase in its subsidy rate to 65% (farmdoc daily July 2, 2025). If the hypothesis of price risk management via publically subsidized revenue insurance is confirmed going forward, private market management of price risk via forward pricing will either have to adapt by offering new products or decline. Will such impacts create backlash from the private risk management sector or will crop insurance mission creep continue?
Data Note: Data and Procedures
Growing season price risk is examined for corn, upland cotton, grain sorghum, and soybeans. Each has a single dominant variety / type that has a largely similar growing season across the US. Thus, insurance prices are the same or similar across most US production areas. Insurance prices for a year consist of (1) a projected price before planting derived from a harvest time futures contract and (2) a harvest time price derived from the same harvest time futures contract. Insurance prices are available electronically from USDA, RMA (US Department of Agriculture, Risk Management Agency) starting with the 2011 crop year. Barnaby calculated insurance prices for these crops back to 1974 using RMA methods. Prices are specifically for the state with the largest production: Illinois and Iowa for corn and soybeans, Texas for upland cotton, and Kansas for sorghum.
Projected revenue per acre equals (projected insurance price times trend yield for the year). Harvest revenue per acre equals (harvest insurance price times harvested yield for the year). Percent change equals ((harvest revenue divided by projected revenue) minus 1). US harvested yields for the 1974-2024 crop years are from Quickstats (USDA, NASS (National Agricultural Statistics Service)). A linear trend yield was estimated for each year using the following time trend relationships:
- Corn yield = 85.73 bushel (bu.) / acre + 1.91 bu. / acre ● (time), where ● = multiply
- Upland Cotton yield = 471.83 pounds. / acre + 8.66 pounds / acre ● (time)
- Sorghum yield = 56.71 bu. / acre + 0.22 bu. / acre ● (time)
- Soybean yield = 26.80 bu. / acre + 0.51 bu. / acre ● (time)
Explanatory power of the equations are 88% for corn, 83% for upland cotton, 12% for grain sorghum, and 90% for soybeans. Time is measured as a count variable from 0 for 1974 to 50 for 2024.
References and Data Sources
Barnaby, Art. December 2015. Personal Communication. Crop Insurance Prices for Selected Crop, 1974 -2012. Kansas State University, Department of Agricultural Economics.
Glauber, J.W. 2013. The Growth of the Federal Crop Insurance Program, 1990– 2011. American Journal of Agricultural Economics 95 (2): 482–8.
US Department of Agriculture, Risk Management Agency. July 2025a. Price Discovery – Many Prices. https://prodwebnlb.rma.usda.gov/apps/PriceDiscovery
US Department of Agriculture, Risk Management Agency. July 2025b. Summary of Business. https://www.rma.usda.gov/SummaryOfBusiness
US Department of Agriculture, National Agricultural Statistics Service. July 2025. QuickStats. http://quickstats.nass.U.S.da.gov/
Zulauf, C., B. Sherrick and G. Schnitkey. “Response to the Increase in 2025 Crop ECO Premium Subsidy.” farmdoc daily (15):121, Department of Agricultural and Consumer Economics, University of Illinois at Urbana-Champaign, July 2, 2025.
Disclaimer: We request all readers, electronic media and others follow our citation guidelines when re-posting articles from farmdoc daily. Guidelines are available here. The farmdoc daily website falls under University of Illinois copyright and intellectual property rights. For a detailed statement, please see the University of Illinois Copyright Information and Policies here.