


2024 Crop Safety Net Payments: Performance of Contemporary Ad Hoc Assistance
This article compares economic loss with safety net payments for the nine large acreage crops that USDA, ERS (US Department of Agriculture, Economic Research Service) reports a cost of production. This comparison is important in part because ad hoc assistance was provided during, not after the 2024 crop year. In-year ad hoc assistance increases the possibility of too much or too little public assistance for the sector and individual crops. 2024 crop safety net assistance is estimated to reduce the nine crop’s collective economic loss from 17% to slightly more than 3% of total economic cost. Coverage of individual crop economic loss varies widely, ranging from 180% (payments exceed economic loss by 80 percentage points) to 45% (payments are 55 percentage points less than economic loss), raising fairness issues.
Procedures and Data
USDA, ERS calculates economic cost of production and net economic return per acre for barley, corn, cotton, oats, peanuts, rice, sorghum, soybeans, and wheat. Economic cost includes opportunity cost for unpaid family labor and owned land and equipment. Economic cost per acre and net economic return per acre were multiplied by US acres planted to 2024 crops (USDA, NASS (National Agricultural Statistics Service)). Collective economic cost and net economic return for the nine crops for 2024 result.
Economic cost is not cash cost that is used in most calculations of returns. However, economic cost are important and in the long run are arguably more important than cash cost. All input cost need to be covered in the long run, not just cash cost. Otherwise use of the input will decline or the input will leave the sector. It can be argued that economic net return provides a more complete and accurate measure of the underlying economic health of a sector, in this case crop agriculture.
Four government programs will make payments to farmers for 2024 crops. Two are ad hoc: ECAP (Emergency Commodity Assistance Program) and SDRP (Supplemental Disaster Relief Program), both authorized in December 2024. Two are standing, (i.e. on-going): crop insurance and commodity programs. Insurance payments are indemnities paid to farmers net of the premiums that farmers paid. They are calculated using USDA, RMA (Risk Management Agency) data. USDA, FSA (Farm Service Agency) reports payments by the other three programs. ECAP and crop insurance payments are largely complete for 2024 crops. Payments by the ARC-CO (Agriculture Risk Coverage – County) and PLC (Price Loss Coverage) commodity programs and especially by the SDRP ad hoc program are not complete and require estimates discussed in the Data Note.
2024 Economic Loss at Harvest
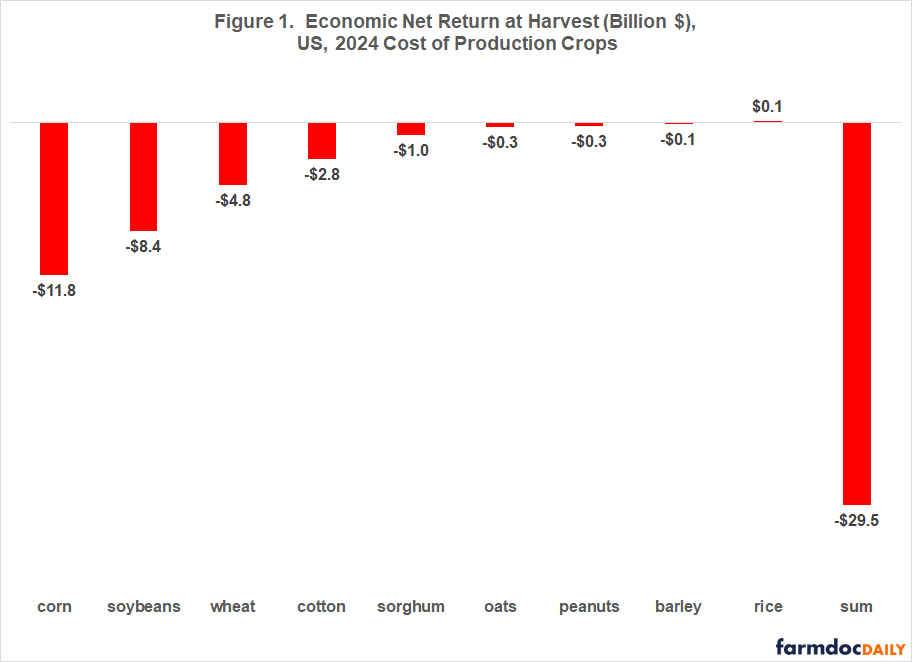
Collectively, the cost of production crops had economic losses of nearly $30 billion at 2024 harvest (see Figure 1). Economic losses were largest for corn and soybeans at $11.8 and $8.4 billion. They reflect economic losses of $130 and $96 per planted acre across 91 and 87 million planted acres, respectively. Economic losses for wheat and cotton of $4.8 and $2.8 billion reflect per acre economic losses of $104 and $251 over 46 and 11 million acres. These four crops account for 91% of all economic losses at 2024 harvest by the nine cost-of-production crops.
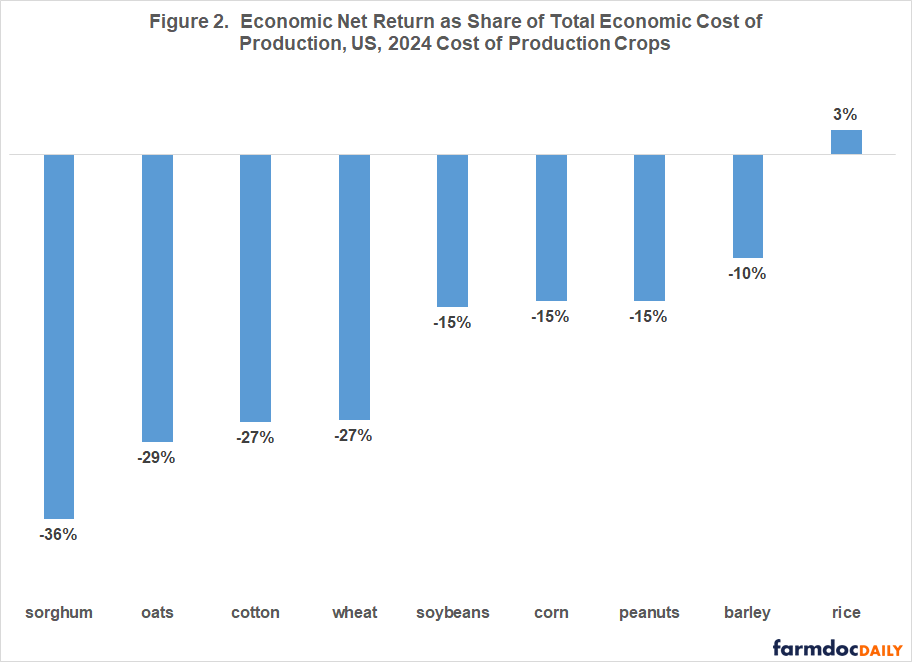
Because planted acres and economic cost of production per planted acre vary considerably across the cost-of-production crops, net economic return is also computed relative to economic cost of production. This ratio can be thought of as an economic profit (loss) margin per acre relative to economic cost of production. By this metric, 2024 harvest economic loss was highest for sorghum (36%) (see Figure 2). Corn and soybean economic loss was 15% while cotton and wheat economic loss was 27%. Rice returns covered total economic cost.
2024 Crop Safety Net Assistance by Program
As of early October 2025, collective government assistance to the cost of production crops is estimated at nearly $24 billion (see Figure 3). Ad hoc programs account for 65% of total assistance, with ECAP providing the most assistance. Smallest assistance is from ARC plus PLC commodity programs.
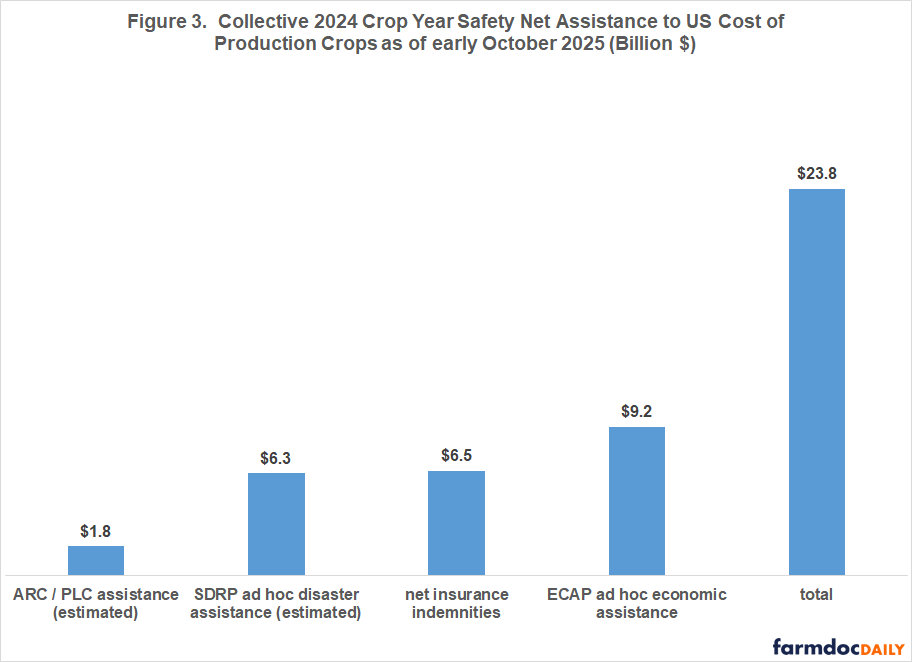
Total crop safety net assistance covers 80.6% of the $29.5 billion in collective economic loss at 2024 harvest for the nine cost of production crops, reducing collective economic loss to $5.7 billion. As a share of total economic cost of production, collective economic loss has declined from 16.8% to 3.3%.
Share of Harvest Economic Loss Covered by Crop
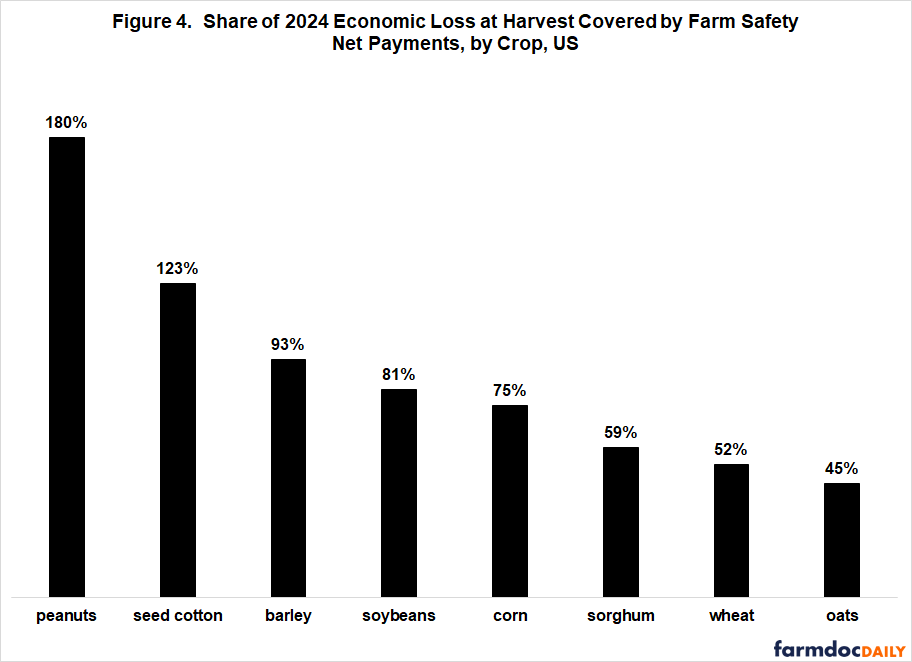
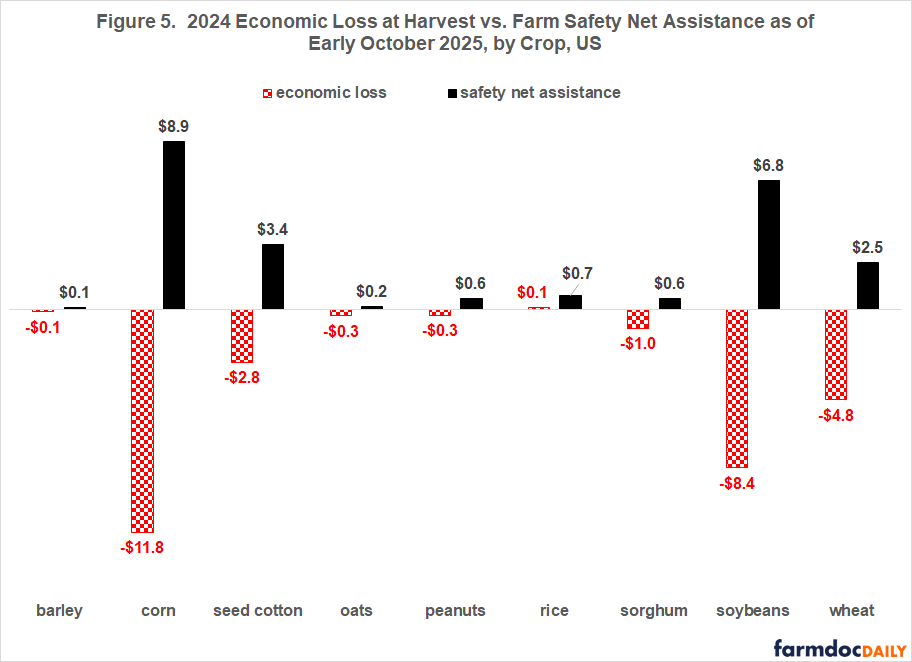
As of early October 2025, crop safety net coverage of economic loss by crop varies widely, from 180% (payments exceed economic loss by 80 percentage points) for peanuts to 45% (payments are 55 percentage points less than economic loss) for oats (see Figure 4). Corn and soybean coverage is 75% and 81%. Seed cotton and wheat coverage is 123% and 52%. Rice is estimated to receive $0.7 billion in total 2024 farm safety net assistance, but is not included in Figure 4 because it had a slight positive net economic return per acre at 2024 harvest. The dollar values of economic losses / return and government assistance by crop are in Figure 5 at the end of this article.
Discussion
Safety net payments to the cost-of-production crops harvested in 2024 are estimated to reduce their collective economic loss from roughly $30 to $6 billion, or from roughly 17% to 3% of economic production costs. Crop safety net assistance has largely offset 2024 economic losses. This offset will mitigate any declines in input prices, including cropland rent. Note, payments not yet made are included in the estimates of government assistance.
Wide difference exists in the coverage of economic loss by crop, ranging from 180% for peanuts (i.e. payments exceed economic loss by 80 percentage points) to 45% (i.e. payments are 55 percentage points less than economic loss) for oats.
Ad hoc programs account for 65% of 2024 assistance. Their assistance was set in December 2024 and thus is contemporary with the 2024 crop year. Contemporary ad hoc assistance appears to be the emerging norm. The 2018 crop year Market Facilitation Program was the first (announced August 2018), followed by contemporary ad hoc assistance several times since, including large COVID-19 assistance.
Providing contemporary ad hoc assistance is timelier than providing ad hoc assistance set after the crop year ends, but information about payments by standing programs is less with contemporary than historic ad hoc assistance. It is reasonable to ask if the widely varying coverage of 2024 economic losses by crop results in part from providing contemporary, not historical ad hoc assistance.
A policy implication is that moving standing crop safety net program payments closer to harvest will allow more informed determination of the need for and amount of contemporary ad hoc assistance. Standing program payments will also occur when farmers are paying bills due for current year’s crops and purchasing inputs for next year’s crops.
This policy change can be achieved for commodity programs by using US harvest cash price instead of US market year price to determine payments. Reference prices would need to be recalibrated to reflect the difference between the two cash prices so outlays remain the same. Estimates of potential PLC payments for the 2025 crop using the latest information from USDA, FSA fall within the $10 to $15 billion range currently being discussed for 2025 ad hoc assistance.
RMA should also determine how soon statistical accuracy exists in setting county yields. The increase to 80% subsidies for county add-up products and thus the likely increase in their use make it important to move the setting of county yields and thus county insurance payments earlier.
Data Note
SDRP ad hoc payments are for losses from natural disaster incurred by crops harvested in 2023 and 2024 (see USDA, July 9, 2025). According to USDA, FSA reported data, as of early October 2025, $5.7 billion in SDRP payments have been made, with 88% to the cost of production crops. Payments are reported by crop. Only so-called Stage 1 SDRP payments have occurred so far. They are based on payments made by crop insurance and NAP (Noninsured Crop Disaster Assistance Program) for 2023 and 2024 crop losses. SDRP payments are reported only in aggregate, not for 2023 and 2024 crops. Stage 1 SDRP payments for 2024 are estimated by multiplying total SDRP payments to a crop by the share of 2023 plus 2024 crop insurance indemnities made to 2024 crops, using USDA, RMA data. Stage 1 SDRP payments to the cost-of-production crops as of early October 2025 are estimated at $2.8 and $2.2 billion for 2023 and 2024, respectively. Stage 2 SDRP payments have not been announced, but will address quality losses and uncovered shallow crop insurance and NAP losses for which no indemnity was paid. Additional Stage 1 payments are possible should funds remain after initial Stage 1 and Stage 2 payments. Payment factor for initial Stage 1 SDRP payments was 35%. Potential SDRP payments for crops are $16 billion. To provide an estimate of total SDRP payments to the cost-of-production crops as a group and by crop, remaining SDRP payments are assumed to have the same proportional distribution across crops and years as current Stage 1 SDRP payments. In other words, current SDRP payments are scaled up to the $16 billion in potential SDRP payments.
ARC-CO and PLC payments for 2024 crops are estimated using the latest available information from USDA, FSA. PLC will make payments to peanuts as its final 2024 market year price has been released. PLC is also expected to make payments to seed cotton as of September 2025 since the 2024 market year price estimate is below seed cotton’s reference price. Peanuts and seed cotton per unit payment rate were multiplied by PLC 2024 payment yield and PLC enrolled 2024 base acres for a county times the 85% payment factor times the 94.3% sequestration factor. Total US PLC payment is the sum of county payments.
For ARC-CO, FSA has announced county level per acre payment rates for barley, oats, peanuts, and wheat. They are multiplied by 2024 ARC-CO enrolled base acres times the 85% payment factor times the 94.3% sequestration factor, then summed to get total 2024 ACR-CO payments to each of the four crops. For corn, rice, seed cotton, sorghum, and soybeans; county payment rate is estimated using the FSA announced 2024 ACR-CO county yield and other 2024 ARC-CO parameters as well as the FSA September 2025 estimate of 2024 marketing year US price. The resulting ARC-CO 2024 county payment rate is multiplied by 2024 ARC0-CO enrolled base acres in the county times the 85% payment factor times the 94.3% sequestration factor, then summed to estimate total US ACR-CO 2024 payments to each of the five crops. Some counties have ARC-CO parameters for irrigated and non-irrigated land. FSA however does not report base acres in a county by irrigated base acres and non-irrigated base acres; they only report total base acres in the county. To be conservative in the estimation of ARC-CO, estimated ARC-CO payments for all counties in which no division is made by irrigation are added to the smaller of (the estimated ARC-CO payments for all counties which were designated irrigated or the estimated ARC-CO payments for all counties designated as non-irrigated).
References and Data Sources
US Department of Agriculture. July 9, 2025. Trump Administration Announces Expedited Congressionally Mandated Disaster Assistance for Farmers. Press Release No. 0158.25. https://www.usda.gov/about-usda/news/press-releases/2025/07/09/trump-administration-announces-expedited-congressionally-mandated-disaster-assistance-farmers
US Department of Agriculture, Farm Service Agency. October 2025. ARC-PLC Program Data https://www.fsa.usda.gov/resources/programs/arc-plc/program-data
US Department of Agriculture, Farm Service Agency. October 2025. Emergency Commodity Assistance Program (ECAP) Dashboard. https://www.fsa.usda.gov/resources/programs/emergency-commodity-assistance-program/dashboard
US Department of Agriculture, Farm Service Agency. October 2025. Supplemental Disaster Relief Program Dashboard, Stage 1. https://www.fsa.usda.gov/resources/programs/supplemental-disaster-relief-program-sdrp/dashboard
US Department of Agriculture, Economic Research Service. October 2025. Cost of Production. https://www.ers.usda.gov/data-products/commodity-costs-and-returns/
US Department of Agriculture, National Agricultural Statistics Service. October 2025. QuickStats. http://quickstats.nass.U.S.da.gov/
US Department of Agriculture, Risk Management Agency. October 2025. Summary of Business. https://www.rma.usda.gov/SummaryOfBusiness
Disclaimer: We request all readers, electronic media and others follow our citation guidelines when re-posting articles from farmdoc daily. Guidelines are available here. The farmdoc daily website falls under University of Illinois copyright and intellectual property rights. For a detailed statement, please see the University of Illinois Copyright Information and Policies here.