


Cash Requirements of Owned Farmland: 2025 vs. 2005
Farmers that own a significant portion of their farmland base typically are in much stronger financial positions today than those who rent a higher percentage of their farmland (see farmdoc daily article from April 1, 2025). We illustrate why this is the case by showing cash flow requirements from purchasing farmland twenty years ago and comparing those cash flows to cash rented farmland. Overall, farmers that bought farmland twenty years ago had to meet larger cash requirements to finance the purchase compared with cash renting but have experienced large capital gains and would now seeing significantly higher returns compared to cash rent farmland. We also show cash flow requirements if a farm were purchased today and speculate on what the results of that purchase will look like in the future if historical trends continue.
Owned vs Cash Rented Farmland
We compare the costs of owning vs cash renting farmland in 2005 to 2025 using the following:
- Land values of $5,000 per acre in 2005 and $16,000 per acre in 2025. Both values are taken from estimates of good to excellent quality farmland as reported in the annual land values publication from the Illinois Society of Professional Farm Managers and Rural Appraisers for those years. An implication is that farmers who purchased farmland in 2005 own an asset that is now worth significantly more.
- A fixed interest rate of around 7% based on data reported by the Chicago Federal Reserve for farm real estate loans in the 7th District in both 2005 and 2025.
- Average property tax and cash rent values from 2005 to 2024 for central Illinois, high-productivity grain farms enrolled in Illinois Farm Business Farm Management (FBFM) and current projections for 2025 (see farmdoc daily article from August 19, 2025).
Cash Flows on 2005 Farmland Purchase
In 2005, good to excellent farmland was valued at $5,000 per acre. A 20-year loan at 7% interest translated to a $378 per acre annual loan payment assuming a 20% down payment ($1,000 per acre down, $4,000 financed). Property taxes averaged $27 per acre, resulting in initial annual cash outlays of $405 per acre ($378 + $27 = $405). Average cash rents in central Illinois were $147 per acre in 2005. Thus, initial annual cash flow requirements for the land purchased in 2005 exceeded cash rent by $257 per acre plus the down payment of $1,000 per acre for a total difference of $1,257 per acre.
The annual debt service requirements on a fixed interest rate real estate loan will not change over time, only the composition of the total payment going towards principal and interest charges. In contrast, both real estate taxes and cash rental rates have increased through time.
Table 1 shows the cash flows from this purchase assuming the farmer had earned the average return from high-productivity farmland in central Illinois given that 50% of the acres are in corn and 50% of acres are in soybeans. Note that we ignore tax implications in our comparison. Table 1 contains eight columns:
- Average farmer return from cash rent. This is the average return had the farmer rented the farmland. These returns are based on historical revenues and costs summarized from Illinois Farm Business Farm Management (FBFM) farms.
- Cash rent is the average cash rent for high productivity farmland in central Illinois from FBFM grain farms.
- Property taxes are the average real estate taxes for high productivity farmland in central Illinois from FBFM grain farms.
- Down payment and ending value. This shows the down payment needed to purchase the farmland in 2005 and the value of the farmland in 2025.
- Debt service is the annual payment for the $4,000 per acre loan assuming a fixed interest rate of 7% and a 20-year term.
- Cash flows from:
- Owning: the net cash flows from owning the farmland. These equal the (1) average farmer return from the cash rent plus (2) cash rent, minus (3) property tax, plus (4) downpayment or ending value, minus (4) debt service.
- Renting: net cash flows from cash rent, which equals the “average farmer return from cash rent” column.
- Difference: net cash flows from owning farmland minus net cash flows from renting farmland.
Owning farmland has many years of negative cash flows, and the cash requirements associated with debt service and property taxes on the owned land consistently exceed the cash rental payments (Difference column is all negative values until the last year), meaning that additional funds from other sources are needed to cover debt servicing costs. On the other hand, cash renting farmland has had mostly positive returns. Average returns from cash renting were negative in 2014 (-$3 per acre), 2015 (-$10), 2023 (-$38), 2024 (-$41) and projected to be negative in 2025 (-35). The current multi-year period of negative returns to cash rented land are concerning.
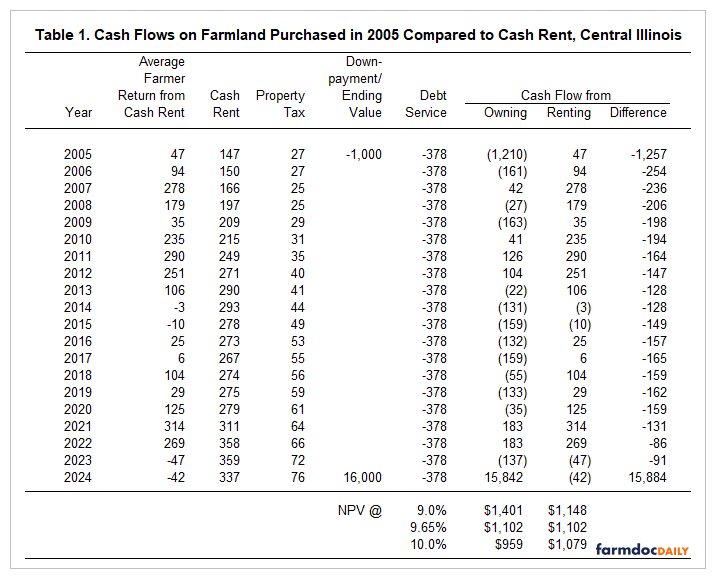
The cash flows from the owned land in 2024 includes the $16,000 ending value for farmland to recognize the capital gain. When this ending value is considered, the present value of the cash flow streams favor owning farmland for discount rates below 9.65% (see lower panel in Table 1). In contrast, the cash renting scenario would be better from a financial perspective if the farmer was able to earn alternative investment returns exceeding 9.65%.
Recognizing the capital gain in the final year is needed to make a fair financial comparison between the farmland purchase and renting. However, in practice, the farmer will likely not realize the capital gain by selling the farmland. Instead, they would continue to own the land and farm. Cash flows from the purchase in 2005 and renting will differ from 2025 on. Owning farmland will no longer have the $378 debt service leading to much larger positive cash flows for owning farmland compared with renting. That will present a significant advantage to the farmer with owned land, particularly during periods of lower returns.
Projected Cash Flows for Farmland Purchased in 2025
In 2025, good to excellent farmland is now valued at $16,000 per acre. A 20-year loan at 7% interest would have a $1,208 per acre annual payment assuming a 20% down payment ($3,200 per acre down, $12,800 financed). Property taxes are currently projected to average $79 per acre in central Illinois, resulting in total initial ownership outlays of $4,487 per acre ($3,200 + $1,208 + $79 = $4,487). Average cash rents in central Illinois are projected at $332 per acre for 2025. Initial annual ownership outlays exceed cash rents by $4,155 per acre.
The initial cash flows for the 2005 and 2025 farmland purchase scenarios are summarized in Table 2 on both a per acre basis (upper panel) and for an 80-acre parcel (lower panel). Initial annual ownership outlays have more than tripled (increase of 220%) from 2005 to 2025. Over the same time period cash rents have more than doubled (increase of 126%). The gap between total initial ownership outlays and cash rent has increased by 231% since 2005.
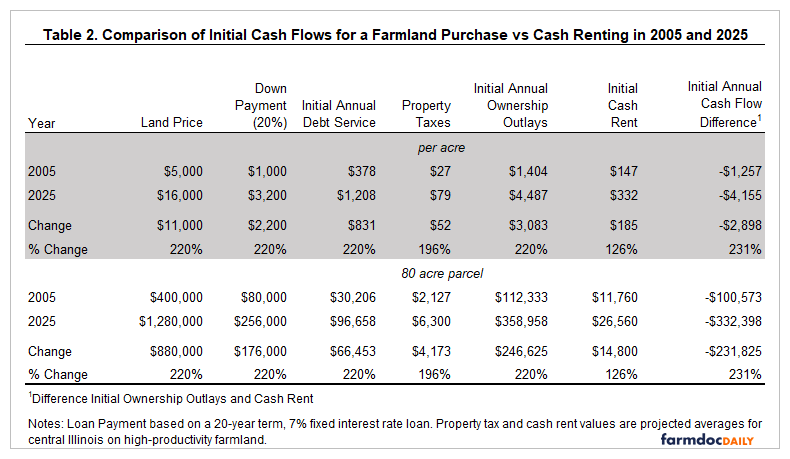
The differences in cash flow requirements for the two purchase scenarios presents serious challenges for farmers looking to purchase farmland today.
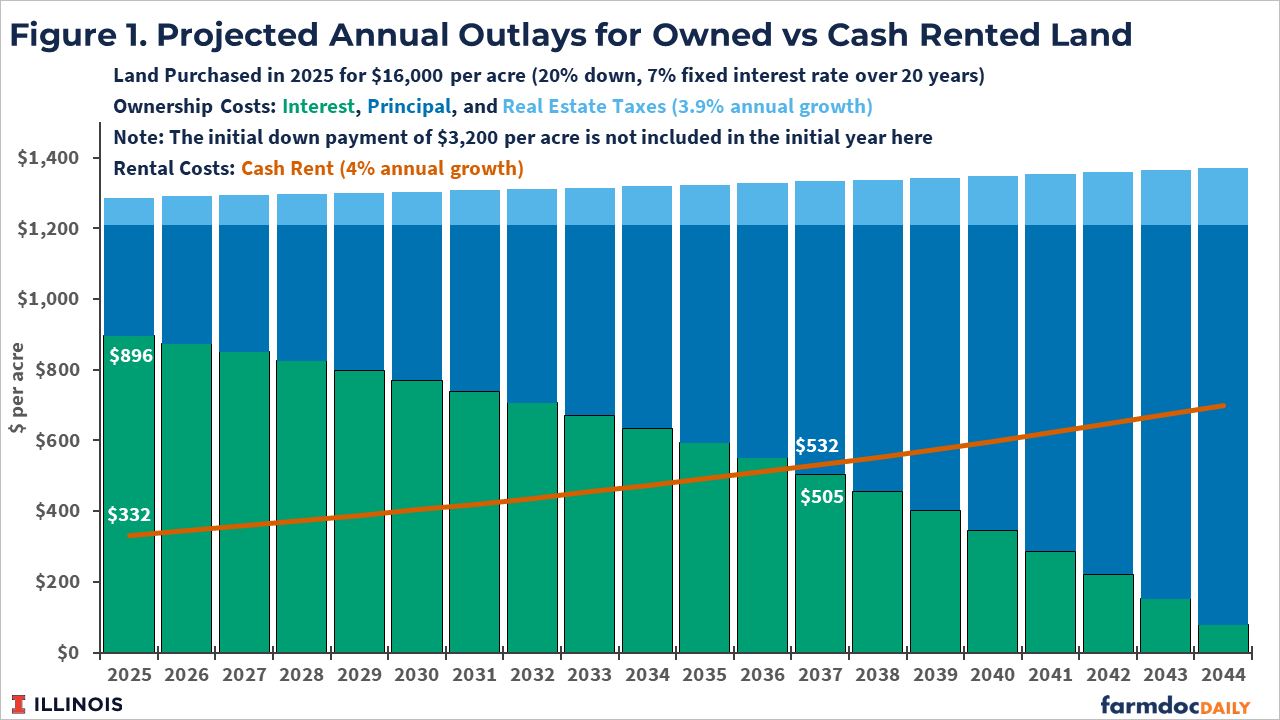
For the 2005 farmland purchase, average cash rents increased and exceeded the interest costs of the farmland loan by 2011, or year 6 of the 20-year repayment period (see Table 1). For the 2025 purchase, assuming a constant 4% growth rate in cash rent and a 3.9% growth rate in real estate taxes – the average historic annualized growth rates for central Illinois – the cash rent level would not be projected to exceed the interest portion of the loan payment until 2037, or 12 years into the 20-year term (see Figure 1).
The initial cash requirements associated with debt service and property taxes are initially nearly 4 times the cash rental rate and this gap continues to be larger than the 2005 purchase scenario throughout the 20-year repayment period (see Figure 2). The initial down payment represents another significant cash requirement at the time of purchase. While the farmland purchase in 2025 would continue to result in higher net present values than cash renting at reasonable discount rates, the sheer size of the cash requirements to finance the farmland purchase are now significantly higher compared with twenty years ago. These additional cash requirements present serious barriers to farmland purchase opportunities to farmers.
Returns on Rented Land Towards a Farmland Purchase
Historically, a common strategy to increase owned land has been to apply the returns earned on rented land towards a future farmland purchase. However, this has become an increasingly difficult strategy as farmer returns on rented farmland have not increased with the cash flow requirements associated with ownership.
Figure 2 shows average farmer returns to cash rented farmland in a 50-50 corn-soybean rotation in central Illinois. Farmer returns have varied around an average of $114 per acre from 2005 through 2024, with no indication of trending upwards. To support the 2005 farmland purchase scenario, roughly 2.5 rented acres would be needed to generate the resources to cover costs of one acre of purchased farmland. In 2025, at the same average farmer return to rented farmland, roughly 8 rented acres would be needed to generate the returns needed to support the additional costs of one acre of purchased land. This is in addition to the significantly larger down payment needed for the 2025 farmland purchase scenario compared with 2005.
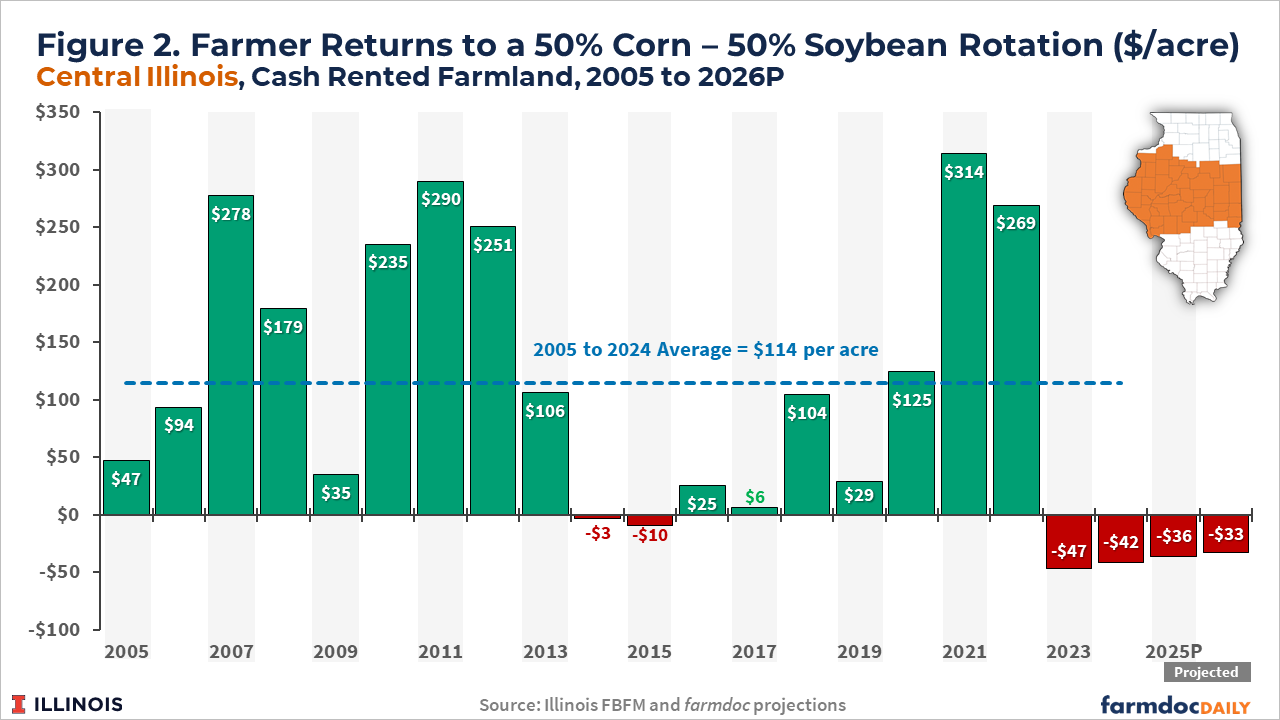
Furthermore, average farmer returns to cash rented land in Illinois were negative in 2023 and 2024 and are projected to be negative for both 2025 and 2026. Rather than building resources that could be applied towards a farmland purchase, four consecutive years of negative returns has quickly eroded the financial positions of farm businesses that are more reliant on rented farmland.
Returns generated on currently owned farmland, particularly if the debt on the owned land has been retired, can build resources towards an additional farmland purchase faster and with fewer acres. This results in an even greater advantage to farm operations with a larger existing owned land base when it comes to acquiring additional farmland.
Total Returns to Farmland Ownership
Future changes in farmland values should also be considered when evaluating ownership vs renting scenarios. Farmland values have historically increased through time and, when coupled with the current returns to farming, have generally provided total returns to owners that are competitive with alternative investments such as U.S. equities (Sherrick and Tsay, 2025). For the 2025 farmland purchase scenario to result in the same relative capital gain as the 2005 purchase, farmland would have to reach a value of $51,200 by 2044.
As the 2005 purchase example showed, historical total returns to farmland suggest the required investment is justified compared with cash renting in standard net present value frameworks at reasonable discount rates. However, the cash requirements associated with ownership costs may be significant enough to create barriers to investment for many interested buyers.
Summary
Over the past twenty years, average cash rents have more than doubled in Illinois while the cash requirements associated with farmland ownership have more than tripled. In contrast, average returns to rented farmland have not trended upward as cost increases for other inputs have offset additional revenues from higher corn and soybean prices and yield increases. This has altered the historical strategy of using returns from rented farmland to generate the resources needed to finance future farmland purchases.
More rented acres are now needed to generate the returns needed to help finance farmland purchases. This has created greater risk exposure for farms that are more heavily reliant on rented farmland. This is becoming particularly evident during the current multi-year period of negative returns to cash rented farmland in Illinois.
Acknowledgment
The authors would like to acknowledge that data used in this study comes from the Illinois Farm Business Farm Management (FBFM) Association. Without Illinois FBFM, information as comprehensive and accurate as this would not be available for educational purposes. FBFM, which consists of 5,000+ farmers and 70 professional field staff, is a not-for-profit organization available to all farm operators in Illinois. FBFM field staff provide on-farm counsel along with recordkeeping, farm financial management, business entity planning and income tax management. For more information, please contact our office located on the campus of the University of Illinois in the Department of Agricultural and Consumer Economics at 217-333-8346 or visit the FBFM website at www.fbfm.org.
References
Paulson, N., G. Schnitkey, B. Zwilling and C. Zulauf. "2026 Illinois Crop Budgets." farmdoc daily (15):150, Department of Agricultural and Consumer Economics, University of Illinois at Urbana-Champaign, August 19, 2025.
Schnitkey, G., C. Zulauf, N. Paulson and B. Zwilling. "Projected Farm Income for 2025: Importance of Rental Arrangements on Farm Income." farmdoc daily (15):60, Department of Agricultural and Consumer Economics, University of Illinois at Urbana-Champaign, April 1, 2025.
Sherrick, B and J. Tsay. 2025. “The Relationship Between Inflation and Farmland Returns.” TIAA Center for Farmland Research white paper.
Disclaimer: We request all readers, electronic media and others follow our citation guidelines when re-posting articles from farmdoc daily. Guidelines are available here. The farmdoc daily website falls under University of Illinois copyright and intellectual property rights. For a detailed statement, please see the University of Illinois Copyright Information and Policies here.