


Individual US Crop Inputs Post 2014 Farm Bill
The high cost to produce US crops remains a topic of concern and key farm policy factor in 2025. This article examines the change in cost by input category since the 2014 Farm Bill authorized the current set of commodity title programs. Percent increase has been highest for chemicals and machinery & equipment. For chemicals, the increase is more likely due to more use than higher prices. For machinery & equipment, higher prices are the more likely reason.
Data and Procedures
Each year USDA, ERS (US Department of Agriculture, Economic Research Service) reports a per acre economic cost to plant barley, corn, cotton, oats, peanuts, rice, sorghum, soybeans, and wheat. These nine crops will subsequently be referred to collectively as the cost of production crops.
Per acre cost for individual input categories were calculated for 2012-2013, the two years prior to the 2014 Farm Bill, and for 2023-2024. Economic cost includes opportunity cost, specifically for unpaid family labor and owned land and machinery & equipment. Also collected was the annual US price index for crop input categories reported by USDA, NASS (National Agricultural Statistics Service) in QuickStats. The last complete year for input prices is 2024.
Cost per acre for an input category for a crop was multiplied by US acres that USDA, NASS reported as planted to the crop in that year, then summed across the nine cost of production crops. The result is the combined cost for an input category to produce the nine crops as a group for the year. Combined cost is arguably more important than cost for an individual crop because crop rotations are common and farmers adjust the mix of crops in response to differential changes in cost across crops. A 2-year period is used because the most common field crop rotation is arguably, corn-soybeans. Percent change in cost and prices from 2012-2013 to 2023-2024 were computed.
Change in Cost by Input Type
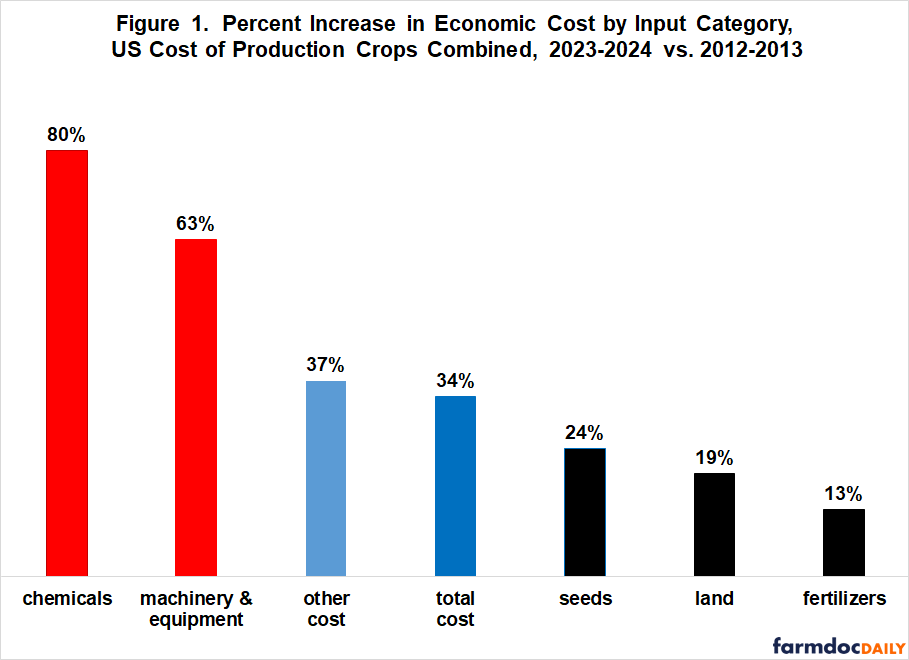
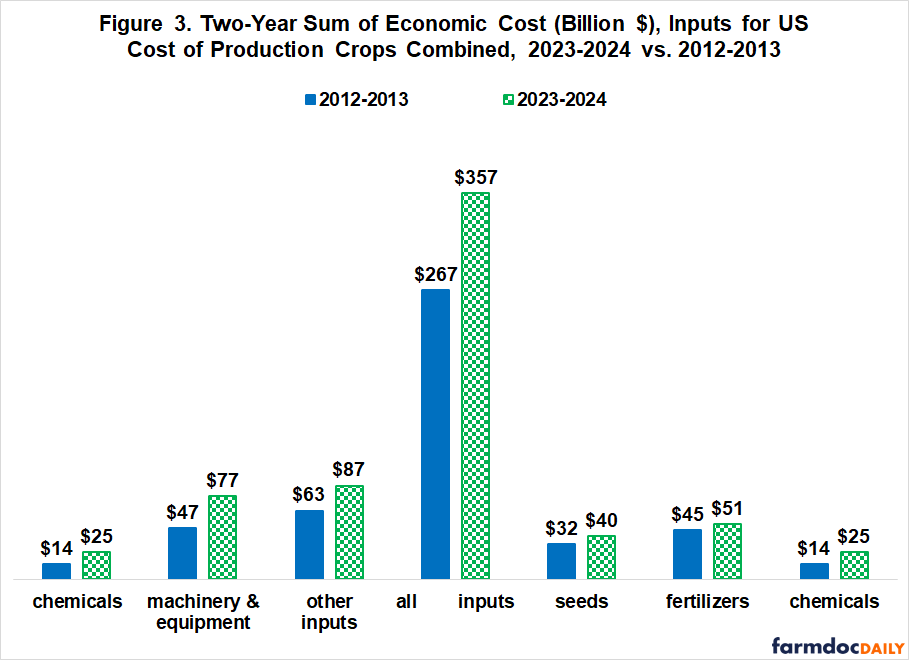
Combined cost for all inputs used to produce the nine cost-of-production crops increased 34% from 2013-2014 to 2023-2024 (see Figure 1). Combined cost for chemicals (80%) increased more than twice as much while combined cost for machinery & equipment (63%) increased nearly twice as much. In contrast, cost of seed, land, and fertilizer rose notably less than total cost. The percent increase in combined total cost was similar to the 32% general US inflation over this period as measured by the GDP price deflator, underscoring the important role general US inflation plays in the cost of US farm inputs (see farmdoc daily of April 30, 2025). Figure 3 at the end of this article has the dollar cost of inputs in both periods. For more discussion of the increase in machinery cost and its implications for farm management, see the farmdoc daily article of October 14, 2025. For a discussion of the current market for US farm machinery and equipment, see the farmdoc daily article of October 24, 2025.
Price vs. Quantity
Cost of an input can increase because price or use increases. Figure 2 presents the percent increase in the price index of inputs for 2023-24 vs. 2012-2013. These price indices do not correspond exactly to the cost categories above. The price index, for example, is for all crops in the US, not just the nine cost of production crops. Still, the price index is useful in evaluating how much of the change in the cost of an input is due to changes in its price verses use.
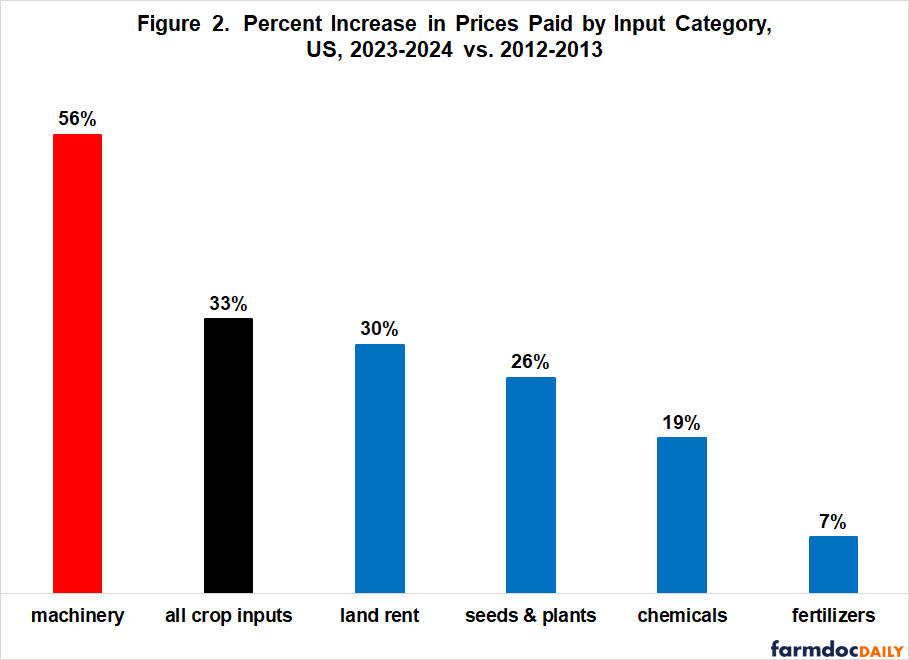
A stark difference exists in the percent increase in cost and price of chemicals. The price index for chemicals increased 19%, 61 percentage points less than the 80% increase in the combined chemical cost to produce the nine crops as a group. Part of this stark difference is undoubtedly due to the differences in measurement discussed in the preceding paragraph, but the difference is so large that use of chemicals is highly likely to have increased notably between 2012-2013 and 2023-2024. In particular, anecdotal evidence suggests that the use of fungicides grew considerably over this period.
For machinery & equipment, land rent, seeds & plants, and fertilizer; the difference between percent increase in cost (Figure 1) and percent increase in price (Figure 2) is small enough that it could be due to the difference in measurement metrics. The implication is that higher price is likely the key factor in the increase in cost of these four input categories.
Discussion
Considerable differences exist in the increase in the cost of individual crop inputs used to produce the nine cost of production crops. Higher cost of chemicals and machinery & equipment stand out. The former likely reflects higher use more than higher prices while the latter likely reflects higher prices.
The notable difference in the increase in cost vs. price of chemicals underscores the importance of tracking both measures in order to more fully understand changes in cost and, by extension, net return.
Despite the attention paid to seed and, especially, fertilizer in recent years; their cost and price have increased less than the cost and price of all crop inputs over the last 10 years.
Of the inputs examined individually in this article, only the price of machinery has increased more than general US price inflation since 2013. Further investigation is warranted into the causes and consequences of the increase in machinery & equipment prices. One hypothesis is that farmers capitalized part of the large crop safety net payments they received over this period into higher prices and thus cost of machinery & equipment.
References and Data Sources
Federal Reserve Bank of St. Louis. October 2025. Federal Reserve Economic Data (FRED) – GDP deflator. https://fred.stlouisfed.org
Mashange, G. “The Current State of Farm Machinery and Equipment Market.” farmdoc daily (15):197, Department of Agricultural and Consumer Economics, University of Illinois at Urbana-Champaign, October 24, 2025.
Schnitkey, G., N. Paulson, C. Zulauf and B. Zwilling. “Large Increase in Machinery Costs Suggests Need to Reconsider Machinery Purchase Decisions.” farmdoc daily (15):189, Department of Agricultural and Consumer Economics, University of Illinois at Urbana-Champaign, October 14, 2025.
US Department of Agriculture, Economic Research Service. October 2025. Cost of Production. https://www.ers.usda.gov/data-products/commodity-costs-and-returns/
US Department of Agriculture, National Agricultural Statistics Service. October 2025. QuickStats. http://quickstats.nass.U.S.da.gov/
Zulauf, C., G. Schnitkey, J. Coppess and N. Paulson. “Are US Crop Production Costs High?” farmdoc daily (15):81, Department of Agricultural and Consumer Economics, University of Illinois at Urbana-Champaign, April 30, 2025.
Disclaimer: We request all readers, electronic media and others follow our citation guidelines when re-posting articles from farmdoc daily. Guidelines are available here. The farmdoc daily website falls under University of Illinois copyright and intellectual property rights. For a detailed statement, please see the University of Illinois Copyright Information and Policies here.