


The Current State of the Farm Machinery and Equipment Market
The farm machinery market continues to face substantial headwinds as waning demand and deteriorating credit quality signal ongoing stress across the sector. Multiple indicators—from manufacturer production cuts to rising loan write-offs—point to a challenging environment confronting dealers, manufacturers, and producers alike. Today’s farmdoc daily article examines recent trends in equipment sales, manufacturer inventories, pricing pressures, and credit market conditions to assess the current state of the farm machinery and equipment sector.
Equipment Sales Remain Deeply Contracted
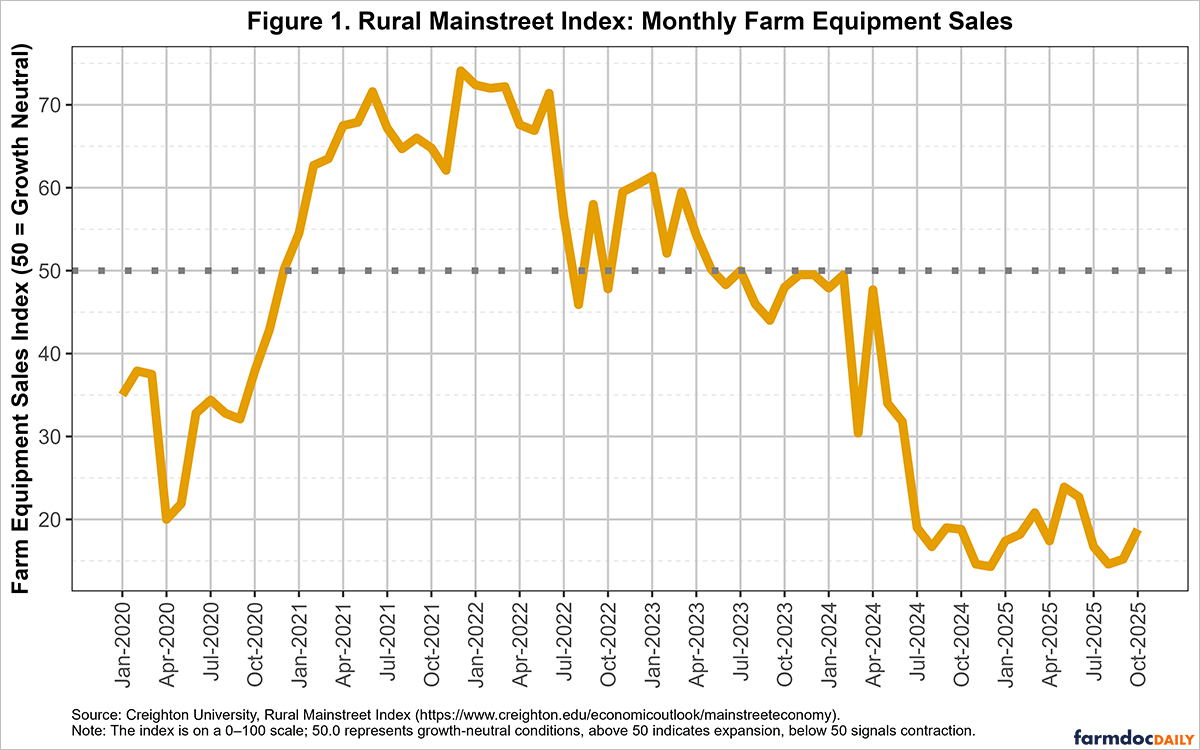
The Rural Mainstreet Index by Creighton University (see Mainstreet Economy), which surveys bank CEOs across a ten-state region, provides monthly assessments of farm equipment sales conditions along with other measures.[1] The index is on a 0-100 scale, where 50 represents growth-neutral conditions. Values above 50 indicate expansion, while those below 50 signal contraction. As shown in Figure 1, the farm equipment sales index has remained below 50 for most of 2024 and throughout 2025, with readings in the teens and low twenties for much of the year. October 2025 saw the index register one of its lowest readings since 2020, indicating substantial contraction in equipment sales activity in the 10-state region.
Manufacturer Inventories Reflect Demand Weakness
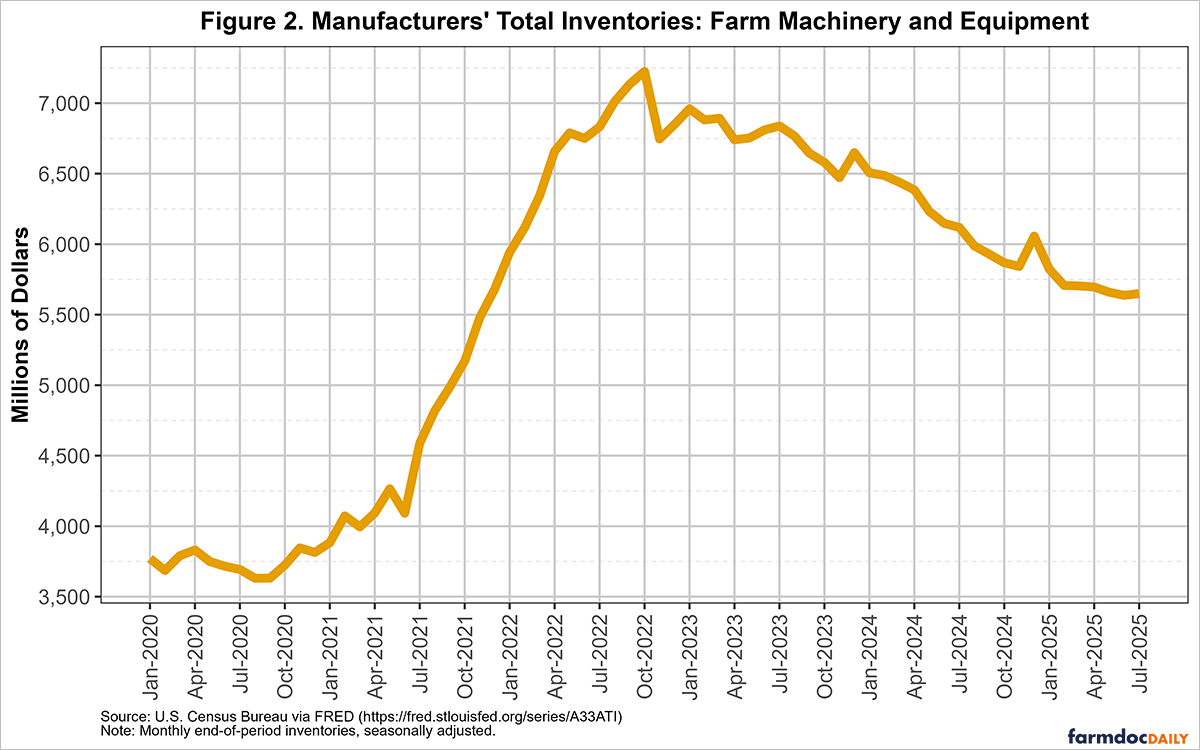
Manufacturer inventory levels provide another perspective on machinery market conditions. According to U.S. Census Bureau data, total inventories in the farm machinery and equipment manufacturing sector peaked at roughly $7.23 billion in October 2022 and have trended downward since. By July 2025, inventories had declined to about $5.65 billion—a 21.85% reduction, though still well above pre-2020 levels. The decline reflects manufacturers’ efforts to realign dealer inventories in response to weak demand. For example, John Deere and CNH Industrial, the parent company of Case IH, New Holland, Steyr, and Raven brands, have scaled back production and have announced multiple rounds of layoffs. Furthermore, CNH announced plans in November 2024 to close its Burlington, Iowa tractor plant by mid-2026.
Easing Price Pressures Amid Low Demand
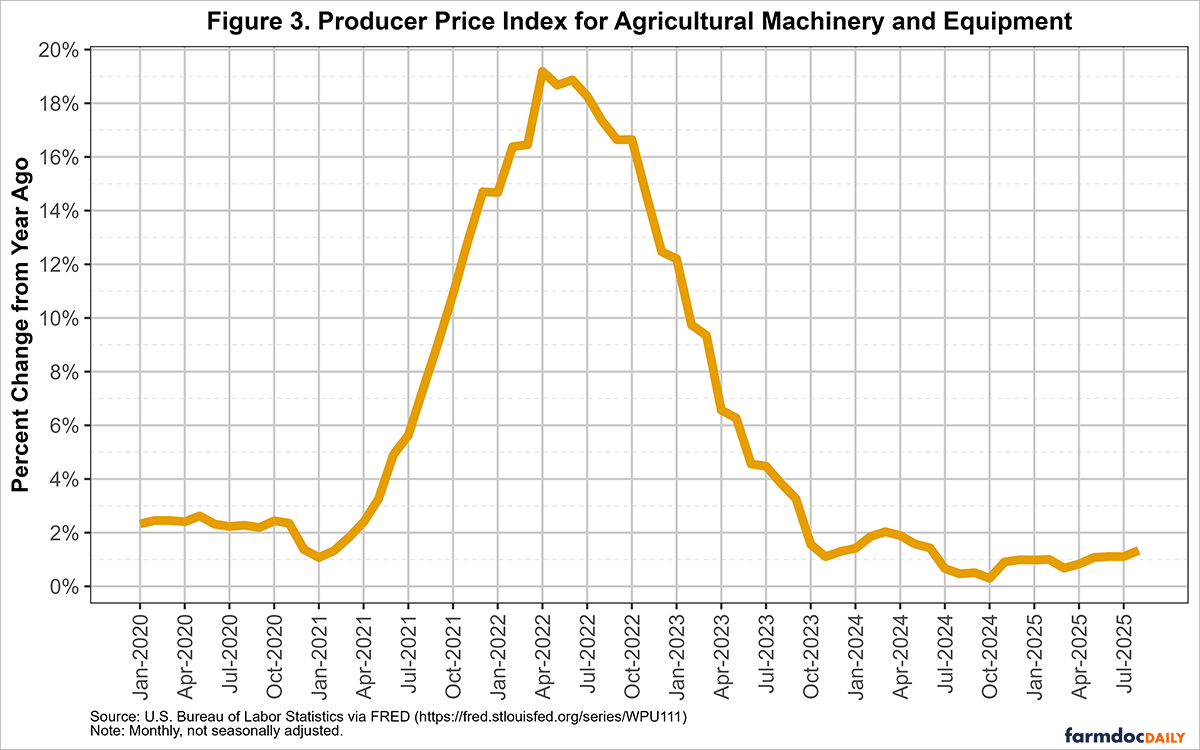
After sharp increases in 2021 and 2022—peaking at a year-over-year increase of over 19% in April 2022—the rate of price increases for agricultural machinery has moderated, as shown in Figure 3. The Producer Price Index (PPI) for agricultural machinery and equipment reflects wholesale prices for tractors, combines, and planters. During the COVID-19 period, supply chain disruptions caused shortages in steel, microchips, and other key inputs, restricting production and driving costs higher. Strong grain prices and farm incomes also fueled farm machinery and equipment demand during the period. More recently, however, declining grain prices and farm incomes—combined with higher borrowing and input costs—have cooled equipment demand. By April 2024, the PPI year-over-year change had slowed to low single digits, reaching just 1.34% in August 2025. However, machinery prices remain well above pre-2021 levels. Our recent farmdoc daily article (October 14, 2025) further examines farm machinery costs and purchase decisions.
Credit Conditions for Farm Machinery and Equipment Loans
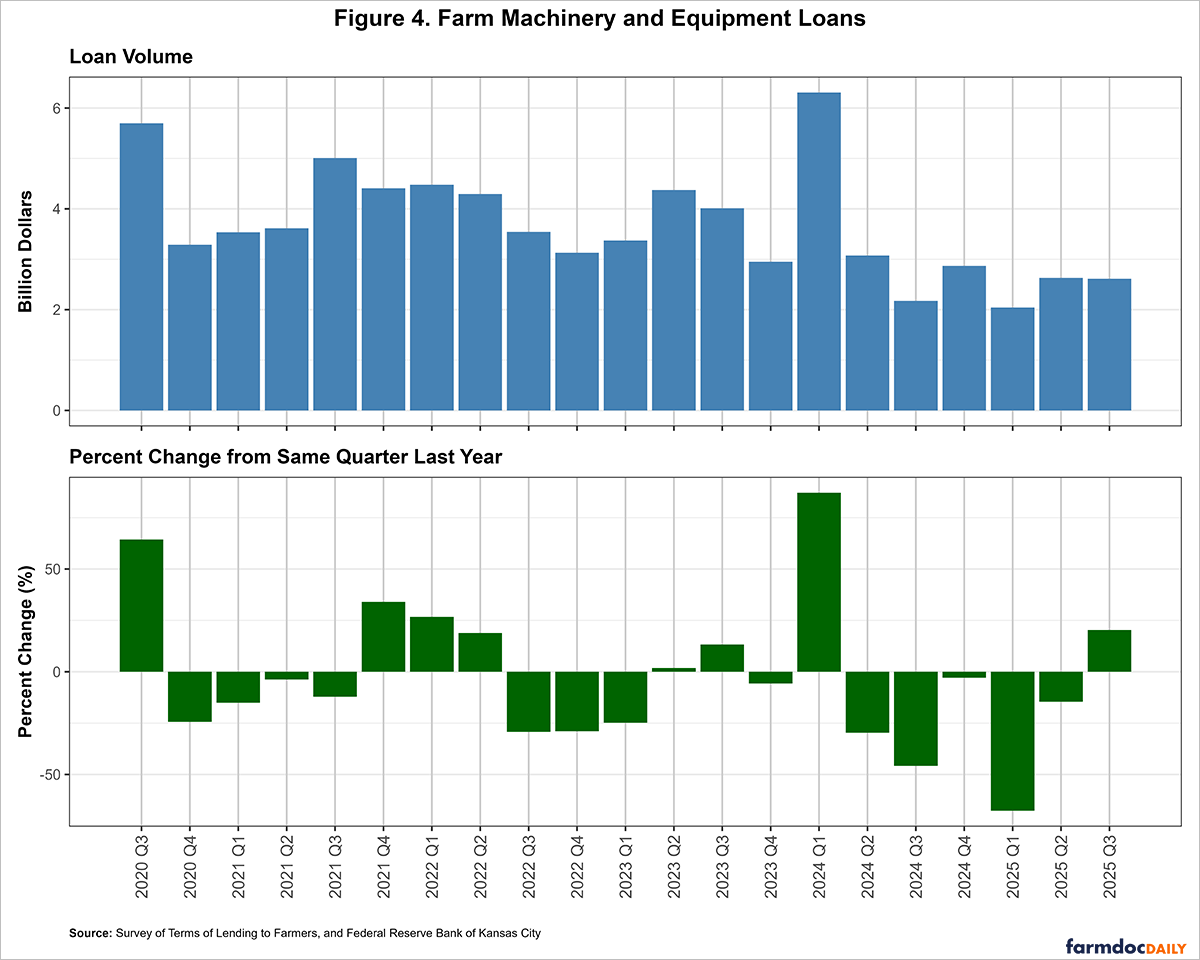
Credit market indicators tell a similar story, as loan volumes for farm machinery and equipment at commercial banks have continued to trend lower, according to data from the Survey of Terms of Lending to Farmers and the Federal Reserve Bank of Kansas City (Figure 4). In the third quarter of 2025, loan volume totaled about $2.61 billion, slightly below $2.63 billion in the previous quarter. Overall, farm machinery and equipment loan activity remains below the volumes observed between 2020 and 2023.
Loan performance data from manufactures does show signs of headwinds as credit quality has deteriorated. John Deere Capital Corporation reported an allowance for credit losses of $247—about 0.46 percent of total receivables—as of July 27, 2025, up from $220 million (0.39 percent) a year earlier. According to the company, the increase reflects higher expected losses on agricultural and turf accounts amid rising delinquencies and weaker market conditions. Non-performing receivables rose from 0.97 percent of total receivables in July 2024 to 1.21 percent a year later. Write-offs for John Deere’s agriculture and turf businesses climbed from $4.8 million during the first nine months of 2021 to $23.5 million by 2024. Similarly, for the six months ended June 30, 2025, CNH Industrial Capital LLC reported write-offs net of recoveries for their retail customers of $27.7 million, up from $10.7 million a year ago.
Conclusion
The farm machinery and equipment market faces mounting challenges across multiple dimensions. Sales remain deeply contracted, manufacturer inventories continue to decline from their peak levels, and credit quality metrics show deterioration at the financing companies of major manufacturers. While price increases have moderated substantially from 2021-2022 peaks, machinery costs remain elevated relative to historical levels. Combined with reduced loan volumes and rising write-offs, these indicators suggest the farm machinery and equipment market downturn may persist as farmers navigate political uncertainty, weak commodity prices, elevated input costs, and tight credit conditions. Manufacturers and dealers will likely continue adjusting production and inventory levels to align with subdued demand, while lenders face increasing pressure from deteriorating loan performance in their agricultural machinery and equipment portfolios.
Note
[1] These ten states include Colorado, Illinois, Iowa, Kansas, Minnesota, Missouri, Nebraska, North Dakota, South Dakota and Wyoming.
References
Schnitkey, G., N. Paulson, C. Zulauf and B. Zwilling. "Large Increase in Machinery Costs Suggests Need to Reconsider Machinery Purchase Decisions." farmdoc daily (15):189, Department of Agricultural and Consumer Economics, University of Illinois at Urbana-Champaign, October 14, 2025.
Disclaimer: We request all readers, electronic media and others follow our citation guidelines when re-posting articles from farmdoc daily. Guidelines are available here. The farmdoc daily website falls under University of Illinois copyright and intellectual property rights. For a detailed statement, please see the University of Illinois Copyright Information and Policies here.