


Regional Cost of Living Differences
Supply chain disruptions, market concentration, global trade shocks, and housing shortages push issues related to affordability and the cost of living to the forefront. However, these pressures are not experienced uniformly; substantial regional cost of living differences shape how households navigate their daily expenses. These disparities can influence overall well‑being and exacerbate economic inequality, particularly in high‑cost metropolitan areas (Campbell, 2021). Variations in housing costs and tax burdens can also inform where people choose to live, underscoring the importance of understanding these regional patterns.
This article draws on the C2ER Cost of Living Index (COLI) to examine regional cost of living disparities and the factors that drive them (www.coli.org).[1] Published since 1968, the COLI provides standardized price comparisons for a basket of goods and services. Unlike the Consumer Price Index (CPI), which measures price changes over time within a given place, the COLI measures price differences across places at a single point in time. These data can therefore illustrate how far a dollar goes in different regions. Each quarter, volunteers in over 270 metropolitan areas nationwide collect the input prices used to construct this index.
The COLI focuses on the prices of common and comparable goods and services. It does not consider different consumption patterns (e.g., how much gas or groceries people purchase) or other factors such as tax rates, wages, or household incomes. Regardless, it remains one of the only regularly updated, widely available dataset that offers consistent, comparable metro‑level measures of relative consumer prices—making it a valuable benchmark for analyzing geographic price variations.
The article begins by highlighting regional cost of living differences before examining which items contribute most to these disparities. Because the COLI primarily reflects metro‑level price patterns, the discussion also considers how spending needs differ between urban and rural households. The article concludes by identifying several avenues for future research.
The Highest Cost of Living is Often Found in Large, Coastal Metro Areas
Figure 1 illustrates cost‑of‑living differences among the metropolitan areas participating in the C2ER Cost of Living Index. Metro areas with index values above 100 are more expensive than the national average, while those below 100 are relatively less costly. The highest‑cost regions are large coastal metros such as the San Francisco Bay Area, Los Angeles, Seattle, New York City, and Washington, D.C. Larger interior regions such as the Chicago and Denver metro areas also expensive, relative to the rest of the country. Remote locations—including those in Alaska and Hawaii—also exhibit elevated living costs, as do fast growing western metro areas such as Bozeman, MT and Flagstaff, AZ.
By contrast, many smaller southern and midwestern metro areas have significantly lower living costs. In the South, this includes cities in Texas (e.g., Brownsville, McAllen, Amarillo) as well as metropolitan areas in Mississippi, Alabama, and Oklahoma. In the Midwest, small metros like Decatur, IL; Ashland, OH; and Salina, KS rank among the least expensive places to live relative to the nation.
Housing Costs Drive Much of the Variation in the Cost of Living
The C2ER COLI provides separate index values for major groups of goods and services—including groceries, housing, utilities, transportation, healthcare, and miscellaneous items—that combined form the composite index. These groups show how much price variation exists between different metro areas for different types of goods and services. Figure 2 shows the distribution of index scores by category and multistate Census region.
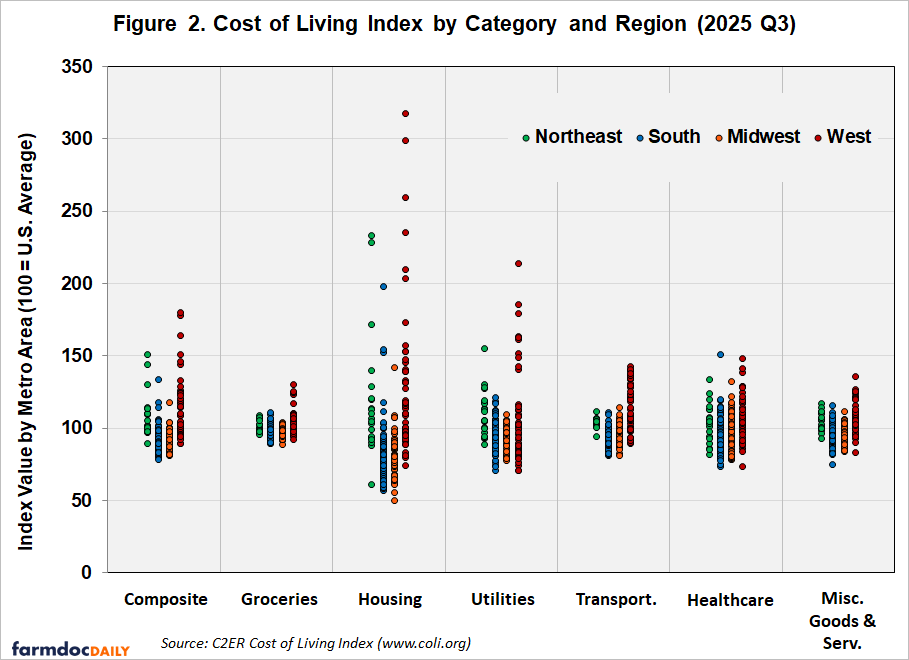
- Groceries: Relative to mother categories, grocery costs exhibit less variation across metro areas. Even among the metro areas with the highest grocery prices, the index value was only about 30% higher than the national average. This consistency reflects the dominance of national supply chains, large retailers (e.g., Walmart, Costco), and the standardized nature of many food products (such as milk), which limit regional price differences. As a result, when grocery prices rise, those increases are felt throughout the country. The highest grocery prices appear in remote areas such as Alaska and Hawaii, as well as in large coastal metros.
- Housing: Housing costs show the greatest variation across metropolitan areas and are the largest driver of overall cost of living differences. Among participating metros, housing costs range from roughly half of the national average to more than triple the national average. The most expensive markets are predominantly large coastal metros—San Francisco, Los Angeles, New York, and Boston—while the lowest housing costs are concentrated in smaller, often economically struggling, metros in the South and Midwest.
- Utilities: Utility prices vary widely due to factors such as climate (which dictates the demand for heating or cooling), infrastructure conditions, and regulatory environments, among others. Among the categories of goods and services included in the COLI, only housing displays greater regional price variation. The highest utility prices appear in Alaska, Hawaii, and California, while states such as Idaho and Louisiana have metro areas with notably lower utility expenses.
- Transportation: Transportation costs range from about 82% to 141% of the national average and reflect prices for gasoline and basic automotive services (such as tire balancing). Among the four U.S. regions, the greatest differences occur between Western metro areas. The highest transportation indices appear in states like California and Washington, where gas taxes and service fees are relatively high. It is important to note, however, that these values capture per‑unit prices, not how much fuel residents consume. Consequently, individuals living in low‑density, car‑dependent metro areas may end up spending more on transportation overall than residents of denser, less car‑dependent regions, even if local gas prices are lower.
- Healthcare: Healthcare costs vary within each of the four U.S. regions, ranging anywhere from 68% to 151% of the U.S. average. These values are based on the relative prices of services like Optometrist, Dentist and Doctors visits, as well as basic healthcare products like Advil and Insulin. These prices do not consider insurance coverage or healthcare access that can affect the extent to which people utilize these services.
- Miscellaneous goods and services: This category includes a collection of basic goods and services purchased throughout the country such as fast food (e.g., a McDonald’s Quarter Pounder), basic haircuts, dry cleaning, clothes (e.g., dress shirt, jeans), beer, wine, etc. Index scores for this category of goods and services ranges between 75% and 136% of the U.S. average and generally tracks with the relative affluence and wage levels found in their respective metro areas. Relatively lower prices for these goods and services are found mostly in smaller southern and midwestern metro areas, although several larger metro areas such as Kansas City, Oklahoma City, and Las Vegas also have relatively lower prices.
Rural Areas Have Different Spending Patterns
The C2ER Cost of Living Index (COLI) focuses primarily on metropolitan areas and does not capture price differences between urban and rural communities. As Weiler and Conroy (2023) note, the lack of rural price data can obscure important differences in the cost pressures faced outside metropolitan regions. They further emphasize that consumption patterns vary substantially across urban and rural settings, and as a result the impacts of price changes and inflation affect rural households differently. For example, rural residents are typically more car‑dependent, making them more sensitive to fluctuations in gasoline prices and the costs of vehicle maintenance. In addition, rural incomes tend to be lower, so even when prices for basic goods are similar across regions, these purchases take up a larger share of rural household budgets.
Urban-rural disparities also extend beyond prices themselves. Rural housing is often less expensive, but many homes are older and less energy‑efficient, leading to higher utility costs. Limited access to restaurants may reduce spending on dining out, but the limited availability of proper grocery stores often forces rural residents to travel farther—spending more time and fuel—to obtain food, especially healthier options such as fresh produce. The more limited availability of essential services (e.g., grocery stores, healthcare providers, etc.) can therefore create significant challenges and additional costs for rural communities (Zimmerman, Rignall, & McAlister, 2023). For instance, limited access to fresh food and healthcare can contribute to longer‑term health disadvantages, just as insufficient broadband infrastructure can depress rural housing values and constrain wealth‑building opportunities through homeownership (Deller & Whitacre, 2019).
Key Takeaways
The price differences described above offer an important foundation for understanding regional cost of living variations. They highlight, for example, that housing drives many of these differences, while grocery prices tend to be relatively consistent across places. Regardless, a complete picture requires additional information about how households in different regions consume goods and services, as well as how inflation and other economic pressures affect communities differently. Better and more comprehensive data are essential for fully capturing these dynamics. The U.S. Bureau of Economic Analysis’ Regional Price Parities provide a comparable index of prices for goods, housing, utilities, and other services across states and metropolitan areas, although that dataset relies more on other federal datasets than on the local price collection used in the C2ER COLI. Both measures, however, focus primarily on metropolitan regions which further underscores the continued need for improved data to understand the cost of living challenges faced by both urban and rural communities.
Note
[1] The full list of items and services that are priced every quarter can be found in the COLI Manual (https://www.coli.org/wp-content/uploads/sites/3/2017/12/2018-COLI-Manual.pdf).
References
Campbell, H. S., Jr. (2021). Income and cost of living: Are less equal places more costly? Social Science Quarterly, 102(6), 2689–2705. https://doi.org/10.1111/ssqu.13017
Council for Community and Economic Research. (2026). C2ER Cost of Living Index (COLI), Q3 2025. https://www.coli.org
Deller, S., & Whitacre, B. (2019). Broadband’s relationship to rural housing values. Papers in Regional Science, 98(5), 2135–2156. https://doi.org/10.1111/pirs.12450
Weiler, S., & Conroy, T. (2023, January 29). Analysis: Cost of living may be rising faster for rural Americans. PBS NewsHour. https://www.pbs.org/newshour/economy/analysis-cost-of-living-may-be-rising-faster-for-rural-americans
Zimmerman, J. N., Rignall, K., & McAlister, C. (2023). The enduring price of place: Revisiting the rural cost of living. Rural Sociology, 88(1), 252–280. https://doi.org/10.1111/ruso.12475
Disclaimer: We request all readers, electronic media and others follow our citation guidelines when re-posting articles from farmdoc daily. Guidelines are available here. The farmdoc daily website falls under University of Illinois copyright and intellectual property rights. For a detailed statement, please see the University of Illinois Copyright Information and Policies here.