


Double Trouble Part 1: Producers Request Larger Loan Levels with Rising Interest Rates
Over the past seven years, the interest expense faced by producers receiving a new USDA Farm Service Agency (FSA) farm loan has increased 50 to 62 percent and the total first-year payment has increased 72-89 percent. This is due to both increases in interest rates and loan amounts. Increases in interest rates can be tied to increases in the Federal Reserve’s target federal funds rate starting in 2021. Increases in the federal funds rate tend to lead to increases in the prime rate, or the rate on which banks base their minimal interest rate charged to their least risky customers. Increases in the average size of farm loans received by farmers points to an underlying need for larger levels of financing. This is likely driven by the increase in the costs of variable and fixed inputs as well as the steady appreciation of farmland prices over the past decade.
This article is part of a two-part series addressing how changes in two key components- farm loan interest rates and average loan amounts- have impacted the average interest expense and first-year loan payment faced by borrowers receiving FSA Guaranteed and Direct Farm Loans between 2005 and 2025. This first article covers changes in interest rates and loan amounts between 2005 and 2025 and potential causes for the rise in loan size. The second part covers the impact of these changes on calculated interest expenses and first year loan payments including potential strategies for the borrower to proactively address these impacts.
FSA Farm Loan Programs
FSA operates two distinct programs: direct and guaranteed loans. Direct loans are directly obligated and serviced by staff at FSA county offices. Interest rates for direct loans are set monthly based upon cost of funds (USDA FSA 2025). Guaranteed loans are obligated and serviced by approved commercial lenders. FSA guarantees the loan up to 95% of principal and interest against borrower default. The specific terms of guaranteed loans are set by the lender and required to be no more than the maximum rate set by FSA and based upon either the daily Secured Overnight Financing Rate (SOFR) or Treasury Rate (USDA FSA 2025). Direct and Guaranteed loan limits are set by congress. In order to qualify for a FSA loan the borrower must meet a given set of criteria including being a primary operator of a family sized farm, be current on all federal debt, have the ability to repay the loan, and be unable to obtain credit commercially in the case of direct loans or without the FSA guarantee in the case of guaranteed loans (USDA FSA b, 2025).
The two primary loan types are operating and farm ownership loans. Operating loans can be used to purchase livestock, seed and equipment, or cover farm operating costs and family living expenses (USDA FSA c, 2025). Farm ownership loans are primarily for the purchase or improvement of farmland including paying closing costs, constructing or improving buildings on the farm, or to conserve and protect soil and water resources (USDA FSA c, 2025). Their term is limited to no more than 40 years.
Trends in FSA Loan Interest Rates, Amounts, and Lengths
Loan data is from the USDA FSA farm loan program and includes information on loan terms, including loan amounts, loan lengths, and interest rates, as well as information on lenders and borrowers. Loan data is averaged across all new obligations in a given year to arrive at annual average interest rates, loan amounts, and loan lengths. This is done separately for guaranteed and direct loans and for farm ownership and operating loans. In addition to longer operating term loans, having a one-to-seven-year term, FSA also provides shorter one-year operating lines of credit. The results for operating lines of credit and term loans are similar, and hence only the results for term operating loans are covered.
Interest Rates
The average interest rate for FSA loans by type of loan and year is shown in Figure 1. Guaranteed loans (GFO and GOL Term in Figure 1) are obligated and serviced by commercial lenders. Hence, their loan rates typically match those of other commercial banks. Direct loans (DFO and DOL Term) are set according to the government cost of funds, and as a result have a lower overall rate than commercial loans. This lower rate allows FSA to assist borrowers without the ability to access funds from traditional credit sources. Regardless of the overall difference in interest rate levels between guaranteed and direct loans, trends in rate movements between the two programs are fairly similar.
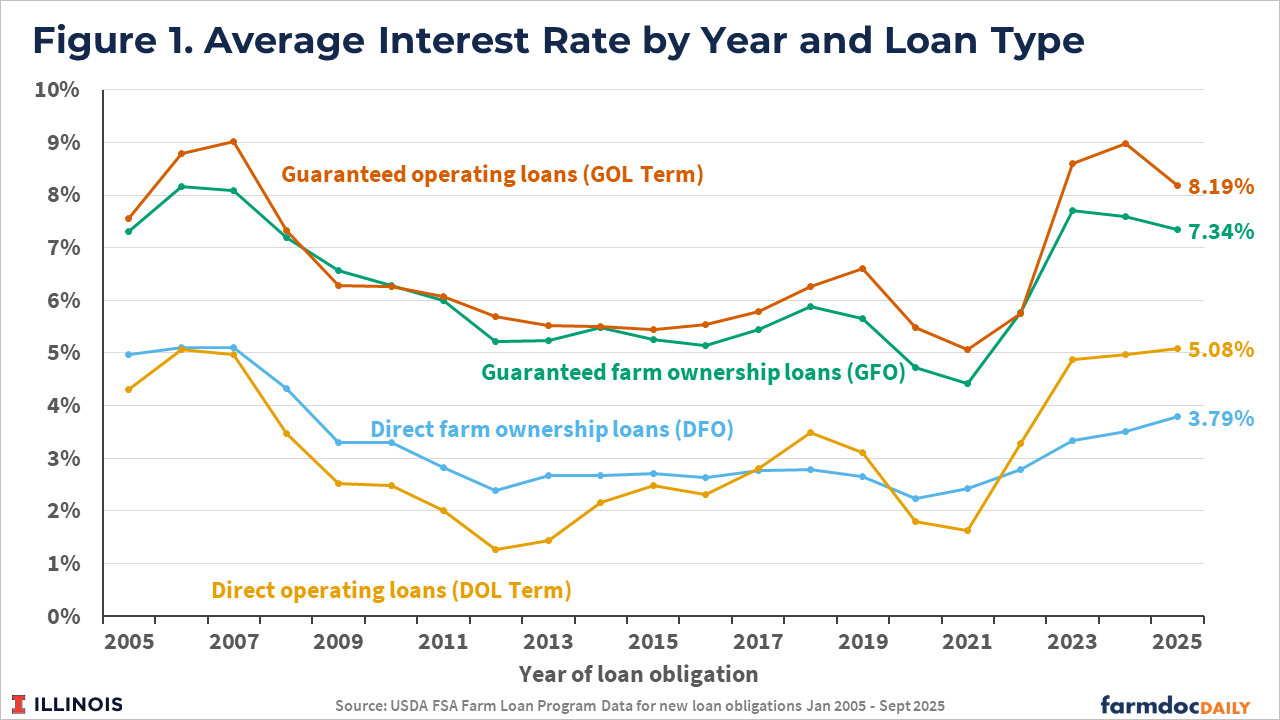
Farm loan interest rates decreased starting in 2007 and remained relatively low through 2016. While briefly spiking in 2019 they again decreased through 2021. Between 2021 and 2025 interest rates began to rise significantly. By the end of 2024 the average interest rate on a new guaranteed and direct farm operating loans was 9.0 and 5.0 percent, equivalent to their 2007 peak level. The average guaranteed farm ownership loan interest rate had risen to 7.2 percent by 2024, just slightly under its 2006 peak of 8.2 percent. The average direct farm ownership loans interest rate had risen to 3.8 percent by the end of 2025, under its peak level of 5.0 percent in 2025 but still significantly above its 2.2 percent low in 2000.
The increases in interest rates starting in 2021 and continuing through 2022 and 2023 were largely due to increases in the prime rate as set by the Federal Reserve. After a period of low and stable prices between 2008 and 2019, furthered by efforts to further cut rates to stabilize the financial markets at the start of the COVID pandemic in 2020, the Federal Reserve began increasing the prime rate in 2021 to combat inflationary pressures. As the prime rate rose, so did benchmark rates such as the SOFR or US treasury yields, measures for which most agricultural lenders peg their loan pricing. These increases lead to overall increases in the average FSA guaranteed and direct farm loan interest rates received for new obligations during this time period.
These patterns are not unique to FSA farm loans. The Kansas City Federal Reserve also observed similar jumps in farm loan interest rates starting in 2021. According to data from the Kansas City Federal Reserve National Survey of Lenders Dataset, between the first quarter of 2022 and the first quarter of 2023, the median interest rate for farm operating loans nearly doubled, reaching slightly below 8 percent by the second quarter of 2025 (author’s calculations using the Kansas City Federal Reserve National Survey of Lenders Dataset Q22025).
Loan Amounts
As illustrated in Figure 2, the average FSA farm loan amount increased between 2005 and 2025 across all loan types.
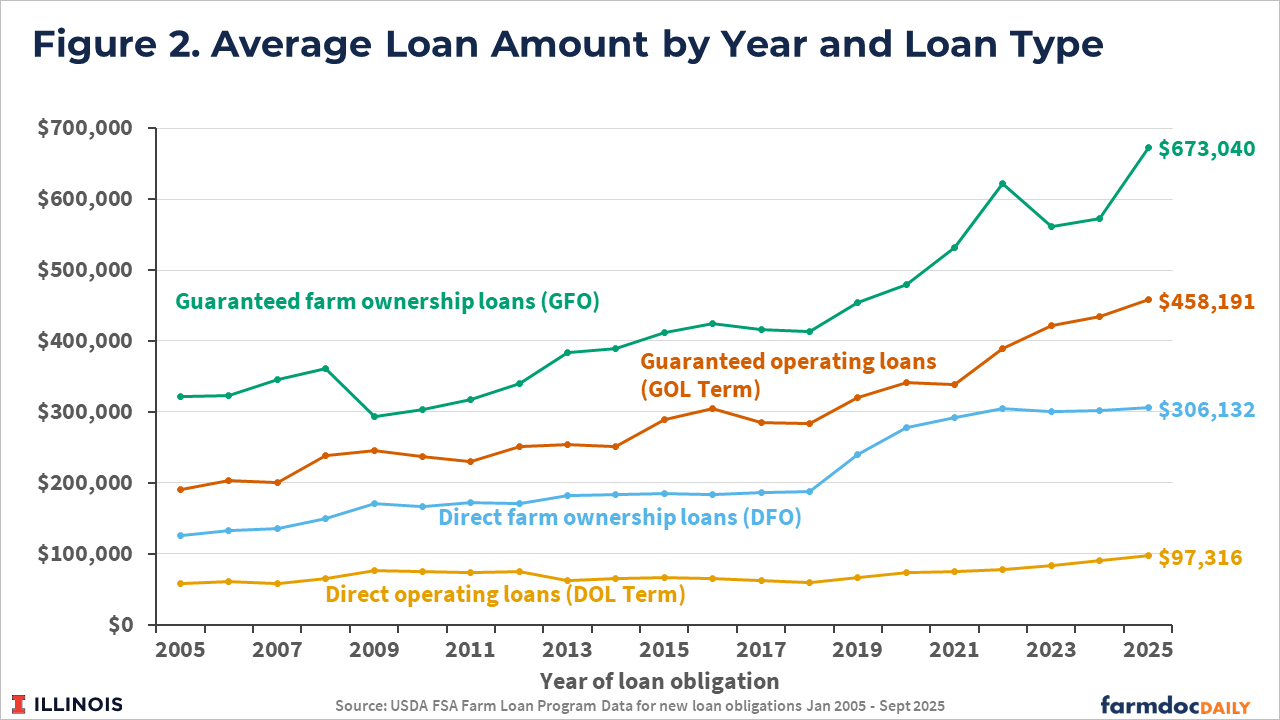
Farm ownership loans on average are larger than operating loans, primarily due to the larger expense associated with purchasing farmland compared to covering operating expenses or livestock and equipment purchases. In general, guaranteed loans tend to be larger than direct loans. They have higher loan limits compared to direct loans in general and are obligated by commercial banks, for whom smaller loans may not be economical (Dodson and Ahrendsen, 2016).
Guaranteed operating loans increased the most, more than tripling from $141,000 on average in 2005 to $458,000 on average by 2025. Guaranteed and direct farm ownership loan amounts more than doubled, from $321,000 for guaranteed farm ownership loans on average and $126,000 for direct farm ownership loans on average in 2005, to $673,000 and $306,000 on average respectively in 2025. Direct operating loans experience the smallest increase in average loan amounts, increasing from $59,000 on average in 2005 to $97,000 on average by 2025.
Similar increases were reported in the Federal Reserve on the National Survey of Lenders. Lenders reported that the average loan size increased 110% percent from $40,000 on average in the first quarter of 2005 to $120,000 average by the first quarter of 2025. This is equivalent to an annual 5% increase each year over 21 years. The greatest increases were for current operating and other loans (124% and 134%) followed by feeder livestock (79%) and other livestock loans (89%). The most significant increases were seen in the size of the largest loans, those over $100,000 increasing 50% in size between the first quarters of 2005 and 2025, as well as the smallest sized loans, with the average size of loans between $3,000-$9,999 increasing 43 percent during that time period (author’s calculations using the Kansas City Federal Reserve National Survey of Lenders Dataset Q22025).
Loan Lengths
The final element impacting the cost of first-year loan payments is the length of the loan. Overall, the average length of a direct operating loan remained relatively constant at 5.4 years in 2005 and 5.3 years in 2025. Similarly, the average length of a guaranteed operating loan was largely unchanged at 6.4 years in 2005 and 6.3 years in 2025. The average length of direct farm operating loans decreased slightly from 36 years in 2005 to 31 years by 2025. The average length of guaranteed farm ownership loans increased slightly from 18 years in 2005 to 24 years in 2025. Direct farm ownership loans had on average a longer term length compared to guaranteed farm ownership loans, despite their smaller overall size, though this gap appears to have decreased over time. This difference will result in further widening the difference in levels of average yearly loan payments between guaranteed and direct farm ownership loan borrowers.
Discussion
One factor that is often cited for larger loan amounts is changes in the congressionally set loan limits for FSA farm loan programs. Direct loans had a maximum loan amount limit of $200,000 prior to 2008. The direct loan limit was increased to $300,000 in the 2008 Farm Bill and then again increased to $400,000 for direct operating loans and $600,000 for direct farm ownership loans in the 2018 Farm Bill. The guaranteed loan limit was increased to $1,094,000 in the 2008 Farm Bill. It was then increased to $1,750,000 in the 2018 Farm Bill. It is now adjusted annually according to inflation and was $2,251,000 for Fiscal Year 2025.
While loan limit increases allow larger loans, the data does not support this as a driving factor for increases in average loan sizes over time. Figure 2 shows that while average loan amounts increased after loan limits were raised in 2018, they increased other years as well, and in fact decreased after the 2008 Farm Bill loan limit increase. Additionally, in most years few producers are constrained by the loan limit. On average less than 5% of the guaranteed loans made in any given year are for the maximum loan amount (Dodson and Ahrendsen, 2016).
One of the most significant driving factors behind the constant increase in average FSA loan amounts is likely the increasing costs of farming inputs, including production inputs, machinery, and farmland. According to USDA Economic Research Service (ERS) Farm Income and Wealth Statistics data, total production expenses increased 25 percent between 2016 and 2025, with interest expenses increasing 53 percent on average, labor expenses increasing 45 percent on average, and intermediate production expenses increasing 30 percent on average (USDA ERS, 2024). These increases in expenses have resulted in greater levels of working capital needed to meet annual production expenses. Many farms rely on short-term financing in the form of operating loans to meet these needs, necessitating an increase in the average size of operating loans.
In addition, farmland prices have steadily increased over the past decade. The average farm real estate value per acre in the United States increased 89 percent between 2011 and 2025, and 39 percent between 2020 and 2025 alone (USDA NASS, 2025). While impressive, these statistics mask the variation in regional price pressure, with cropland prices in California and Northeastern states and pastureland in east-coast and mid-south reporting higher than the average land prices. The rise in farmland prices has led to larger farmland loan amounts needed to finance the purchase of the same parcel of land over time. The impacts of increasing loan sizes and higher interest rates on producers will be discussed in the second part of this series, including potential strategies for producers to successfully manage the need for larger levels of financing.
References
Charles B. Dodson, and Bruce L. Ahrendsen. “Structural Change Implies Unique Role for Federal Credit.” Choices 31, no. 1 (2016): 1–10. http://www.jstor.org/stable/choices.31.1.12.
Kansas City Federal Reserve. “National Survey of Terms of Lending Historical Data Q22025.” Accessed September 11, 2025.
USDA ERS. “Farm Income and Wealth Statistics- Production Expenses.” Updated September 3, 2024. https://data.ers.usda.gov/reports.aspx?ID=4059.
USDA FSA. “Current FSA Loan Interest Rates.” Accessed November 12, 2025. https://www.fsa.usda.gov/tools/informational/rates/current-fsa-loan-interest-rates.
USDA FSA b. “Farm Ownership Loans.” Accessed November 12, 2025. https://www.fsa.usda.gov/resources/farm-loan-programs/farm-ownership-loans.
USDA FSA c. “Farm Loan Programs”. https://www.fsa.usda.gov/resources/farm-loan-programs. November 12, 2025.
USDA NASS. “Charts and Maps- Land Values: Average Real Estate Value by Year, US.” Accessed December 2, 2025. https://www.nass.usda.gov/Charts_and_Maps/Land_Values/farm_value_hist_chart.php.
Disclaimer: We request all readers, electronic media and others follow our citation guidelines when re-posting articles from farmdoc daily. Guidelines are available here. The farmdoc daily website falls under University of Illinois copyright and intellectual property rights. For a detailed statement, please see the University of Illinois Copyright Information and Policies here.